Blog: Guides, Science and Evidence Updates (Page 7)
Every article on the index, newest first. 200 articles.
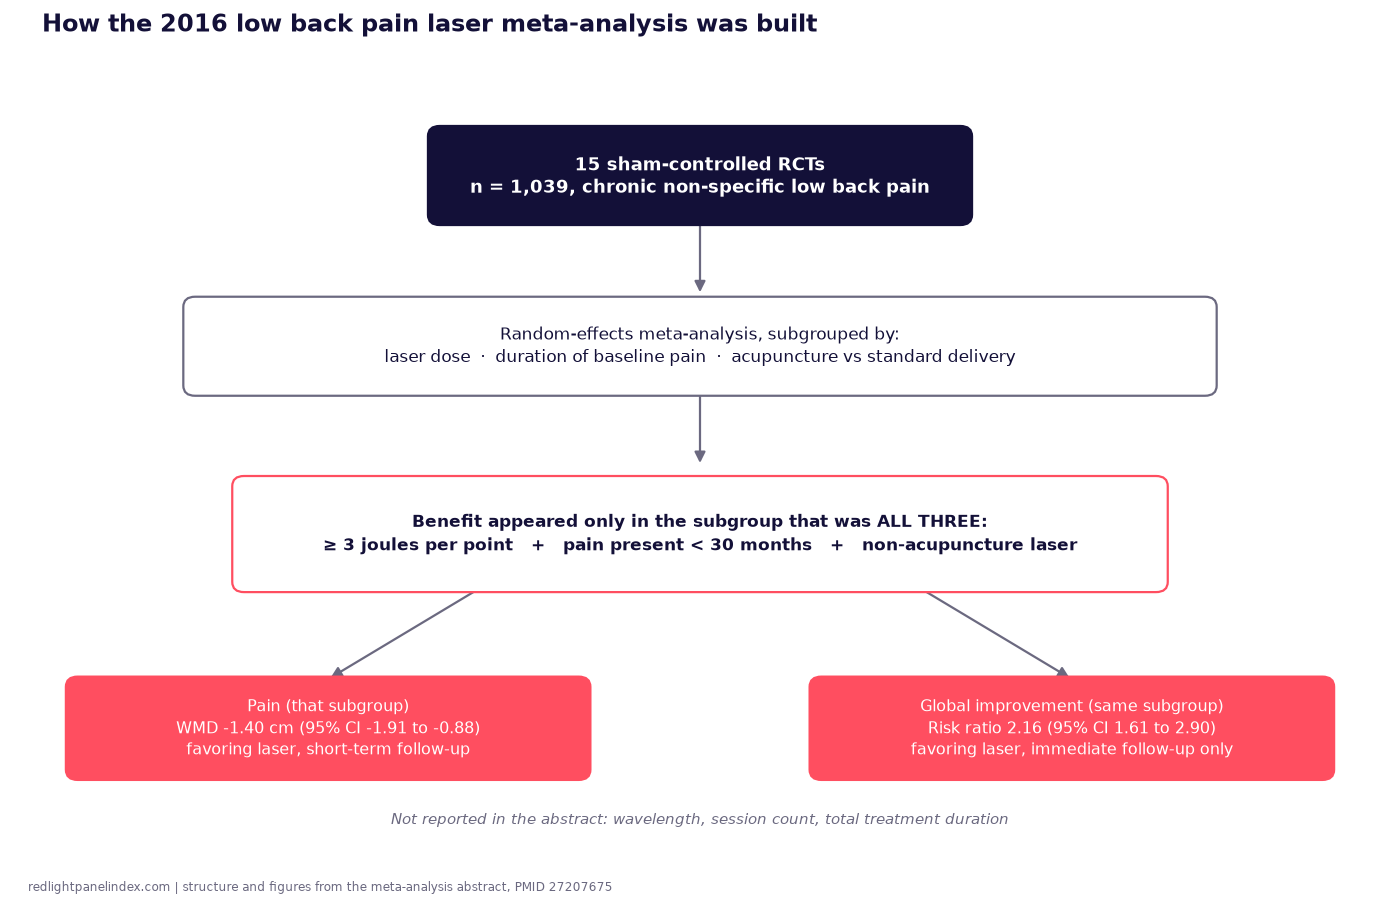
Red Light Therapy for Back Pain: What the Laser Trials Found
A 2016 meta-analysis of 15 trials found moderate-quality evidence for short-term back pain relief, but only above a laser dose threshold.
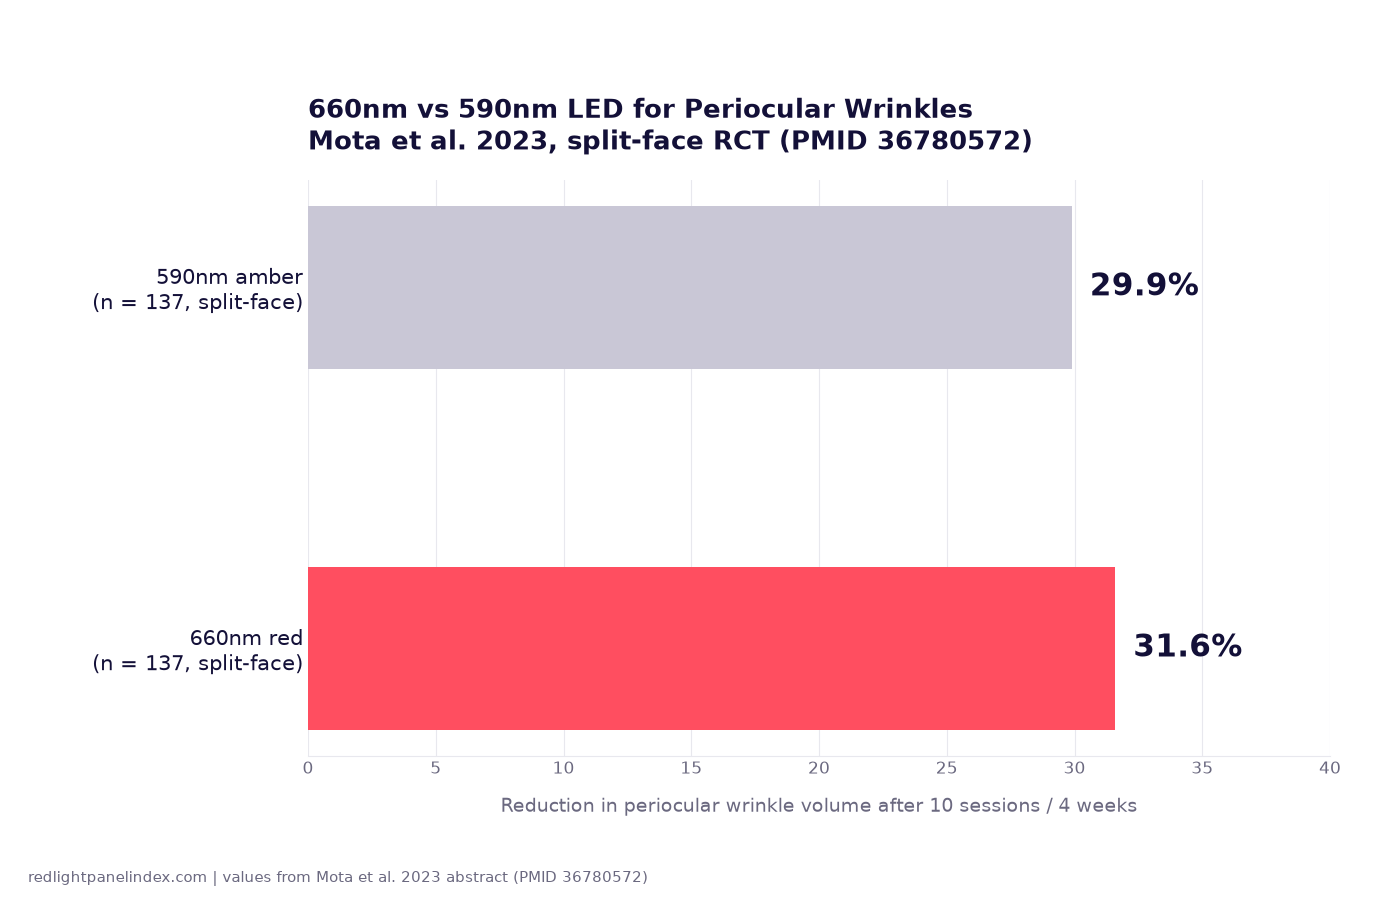
Study Review: 660nm LED for Periocular Wrinkles (2023)
A 137-woman split-face RCT compared 660nm red and 590nm amber LEDs at a matched 3.8 J/cm2 dose. What it found, and what it left out.
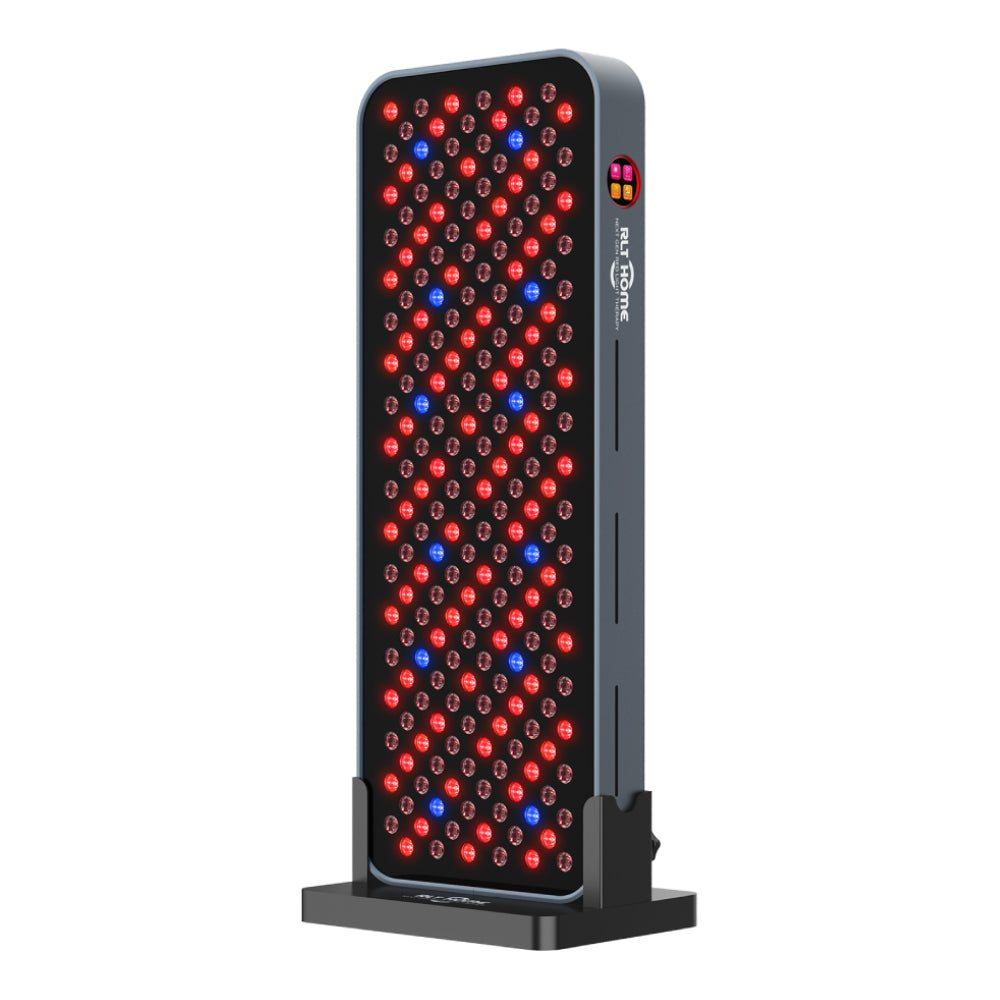
Best Red Light Panels for Skin and Anti-Aging
Panels ranked for facial and skin use on published 630-660nm plus 830nm density, method-labeled irradiance, and buyer terms.
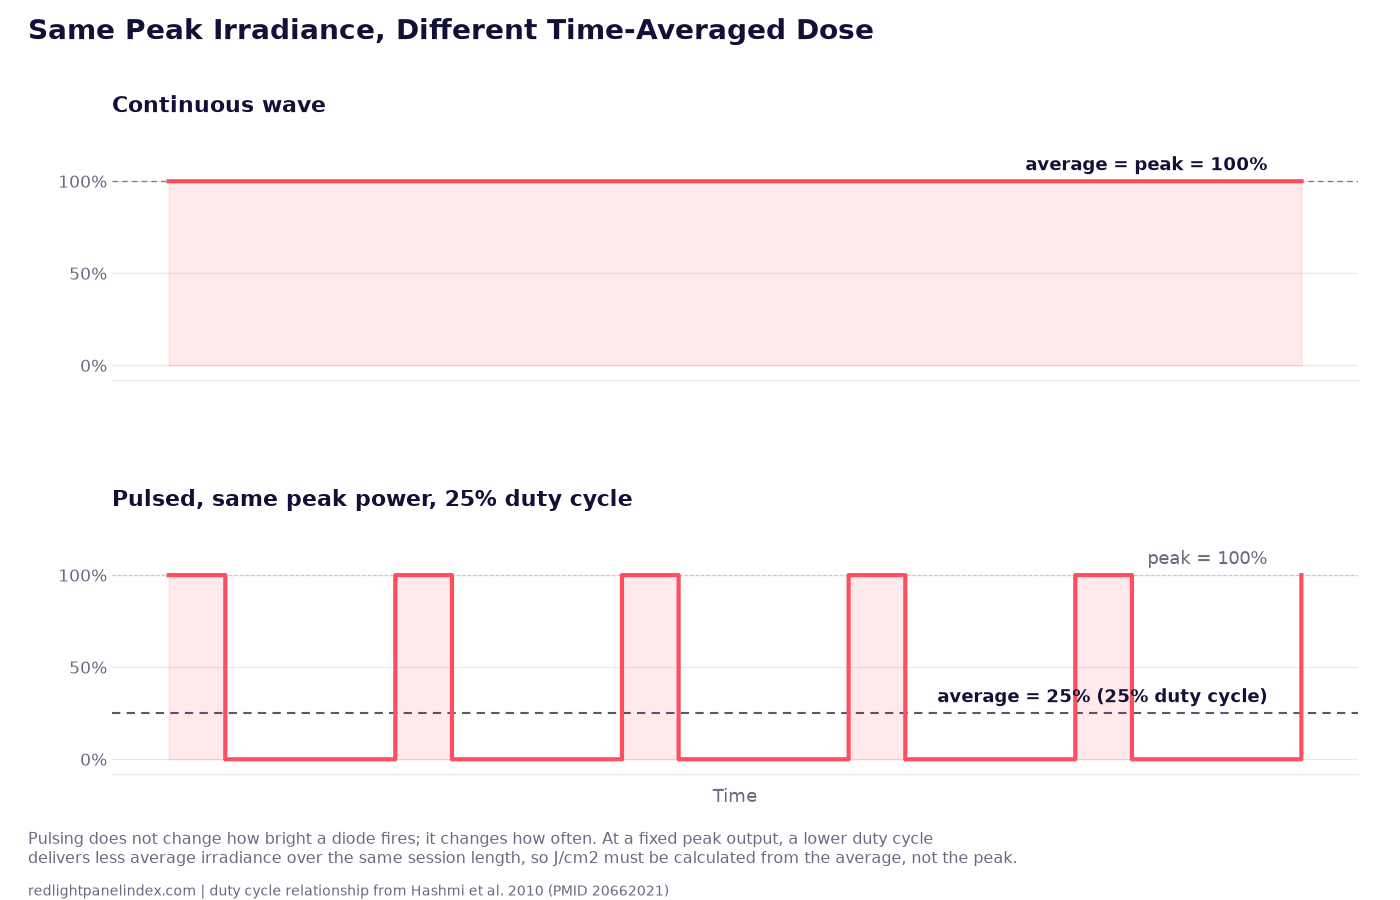
Pulsed vs Continuous Red Light: What the Evidence Says
A 2010 review of pulsing in low-level light therapy found mixed, condition-specific results and no general advantage over continuous light.
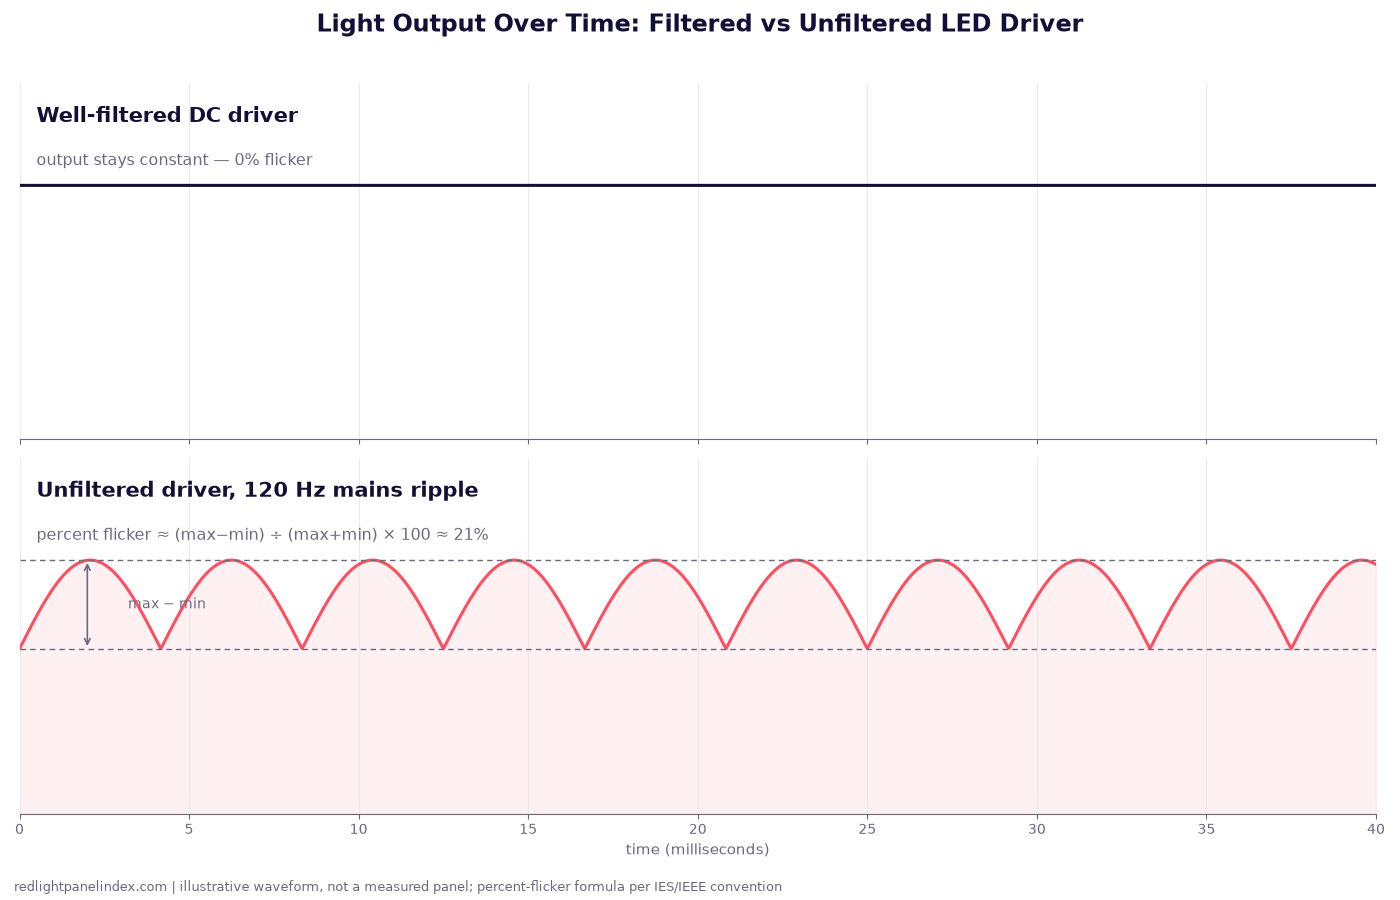
Flicker in LED Panels: What It Is and Whether It Matters
Percent flicker and flicker index explain the rapid brightness cycling a driver can leave in LED output, and why it is a comfort issue, not a therapeutic one.
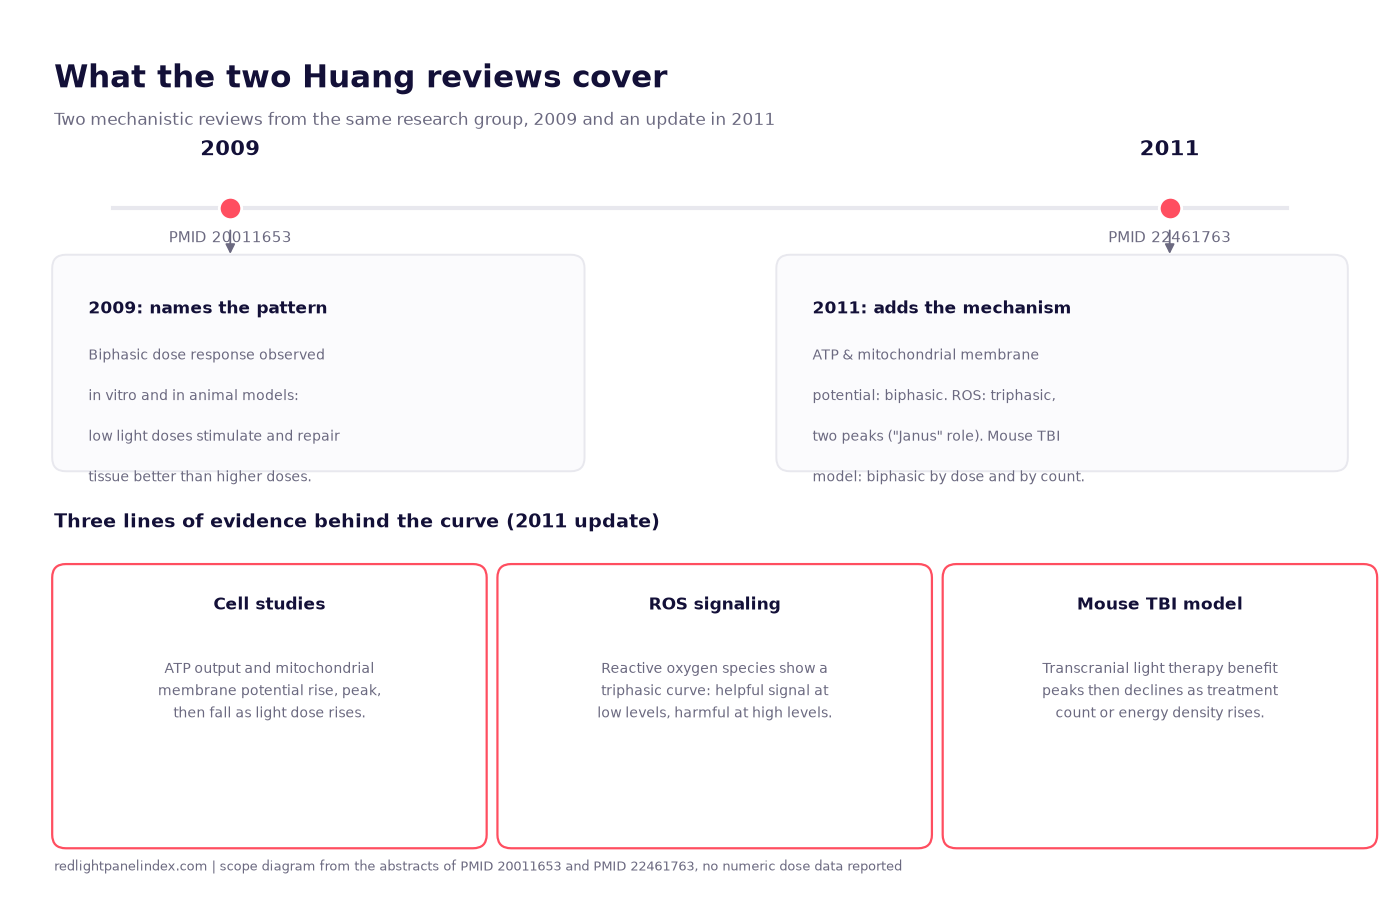
Study Review: The Biphasic Dose Response Papers
Two mechanistic reviews describe why more light does not mean a better result. What each paper covers, and what it leaves unanswered for a home panel.
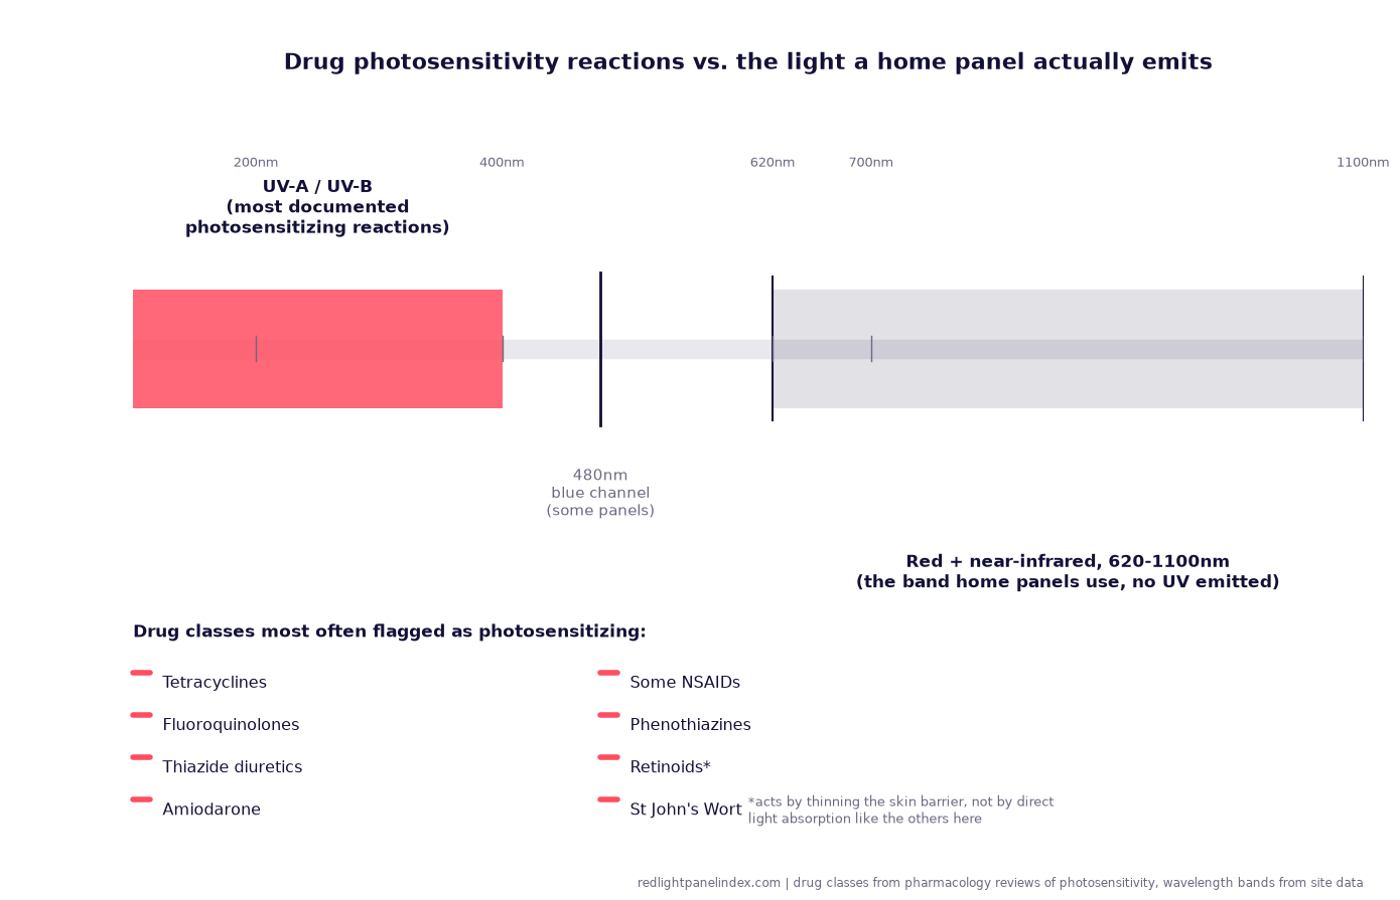
Red Light Therapy and Photosensitizing Medications
Drug classes flagged as photosensitizing, why most of that evidence is about UV light rather than red or near-infrared, and when to check with a prescriber first.
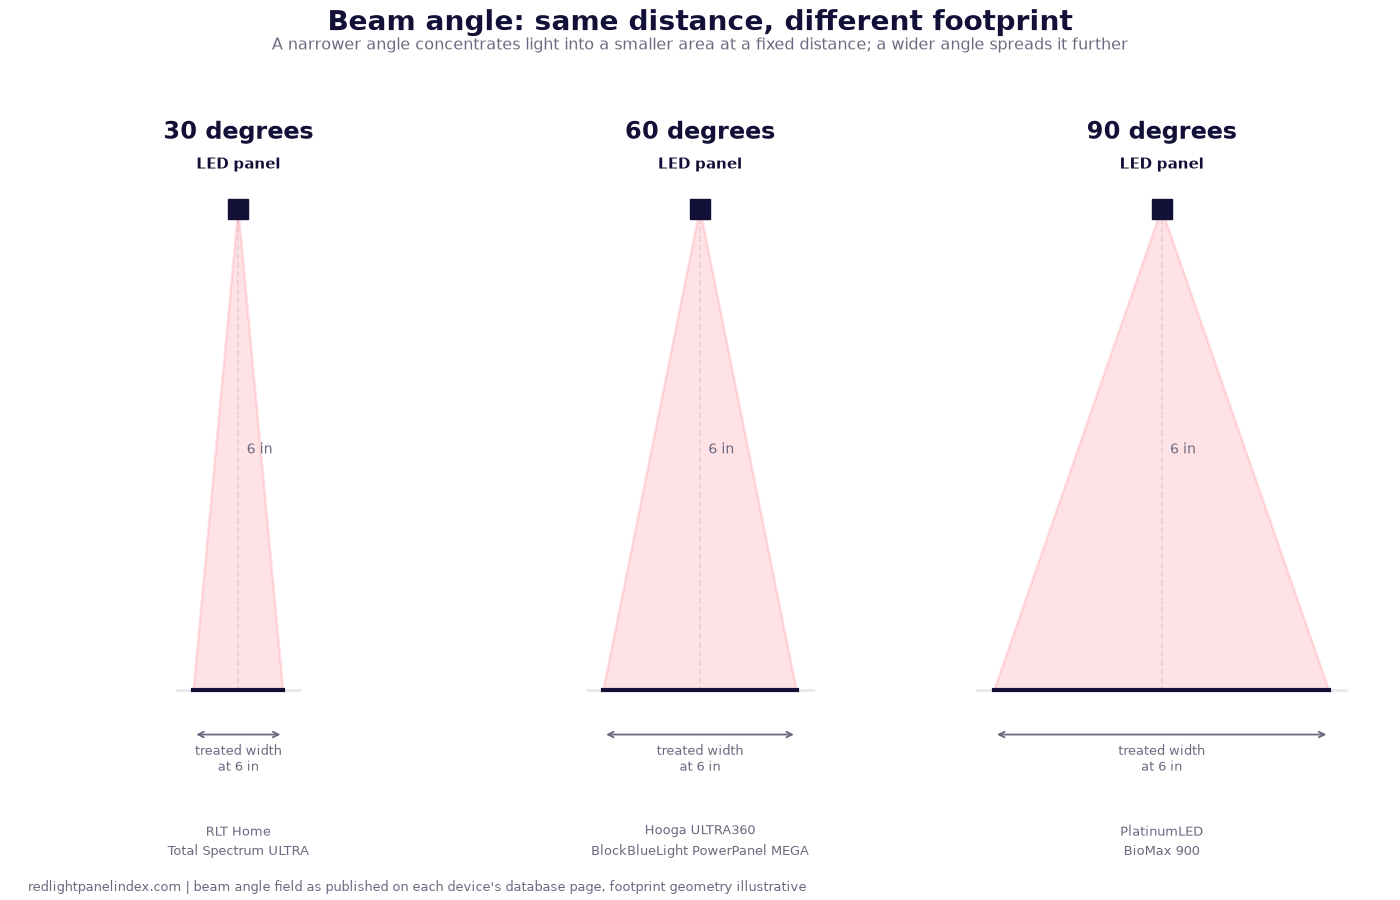
Beam Angle Explained: 30 vs 60 vs 90 Degrees
Beam angle sets how tightly an LED panel's light concentrates at a given distance, and how much area it covers. What 30, 60 and 90 degrees trade off.
Red Light Therapy for Acne: What the Combination Trials Show
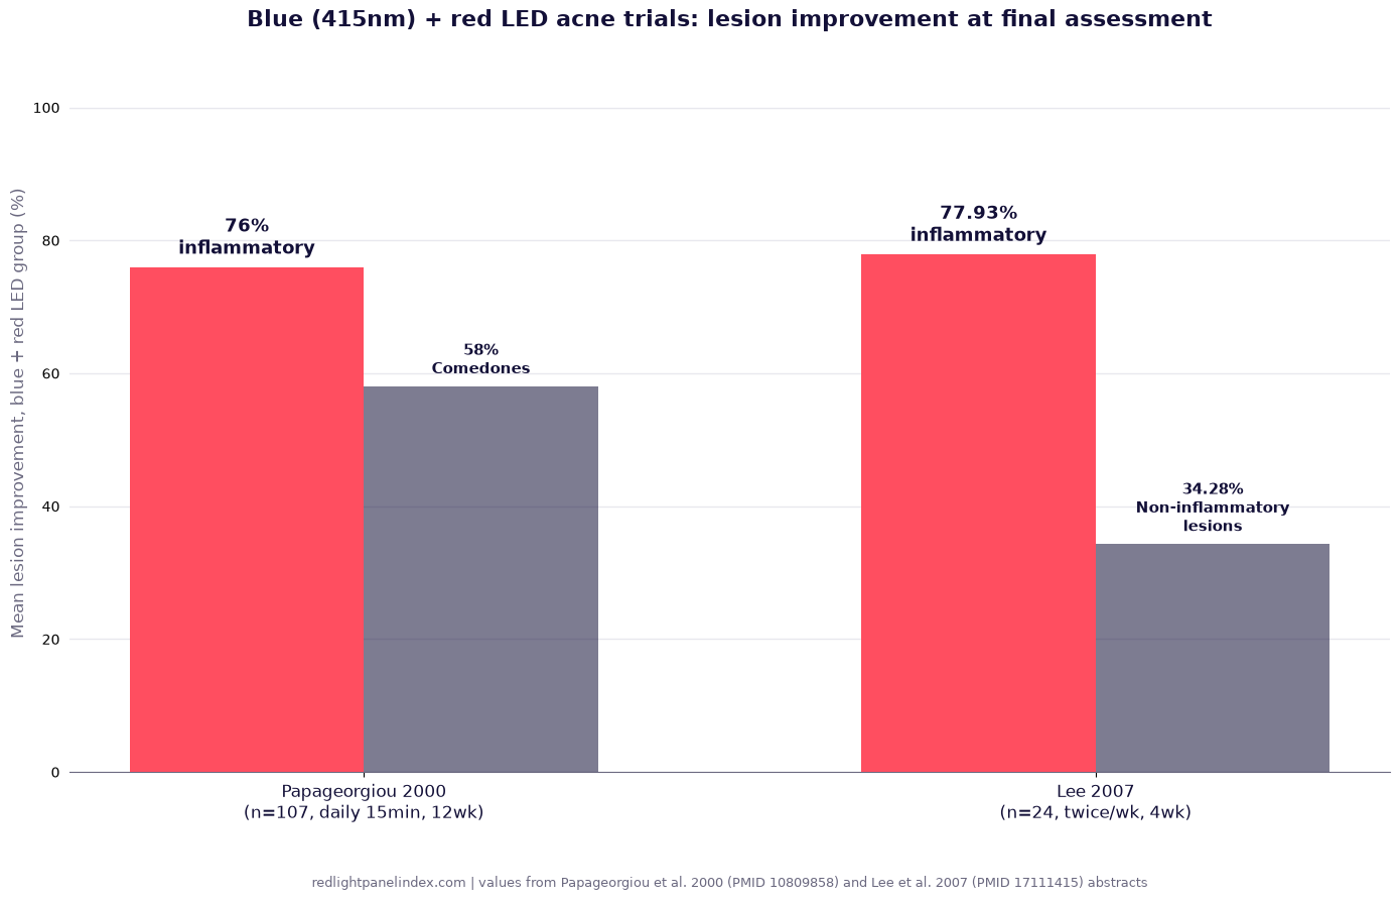
What two randomized trials on blue-plus-red LED light found for acne, why most home panels lack the blue channel they used, and what has not been tested.
How Long Should a Red Light Therapy Session Be?
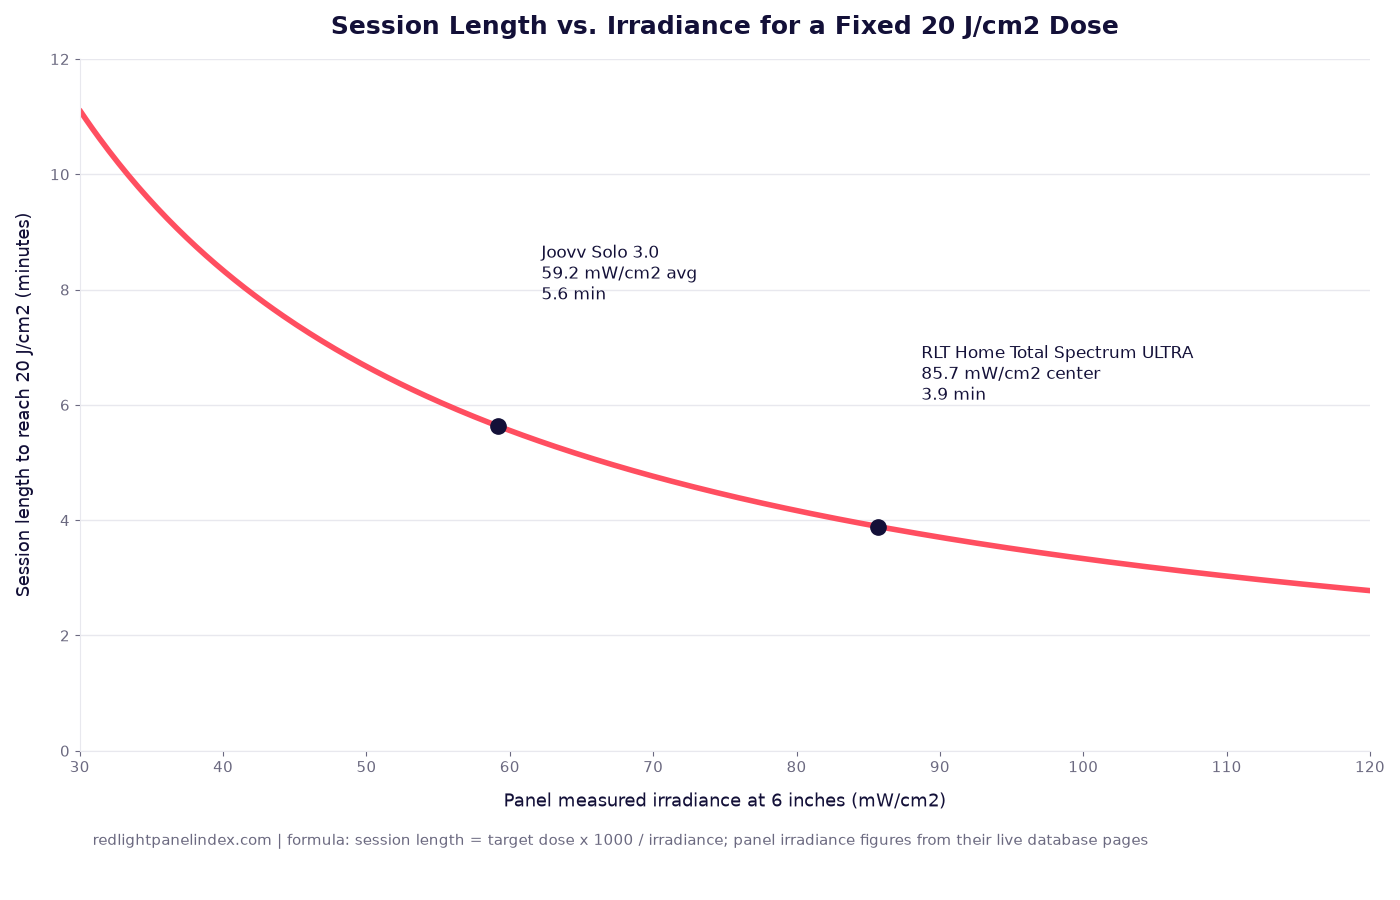
Session length follows from a target dose divided by your panel's measured irradiance. The formula, two worked examples, and the ceiling not to chase.
Joules per cm2 Explained: How Red Light Dose Is Measured
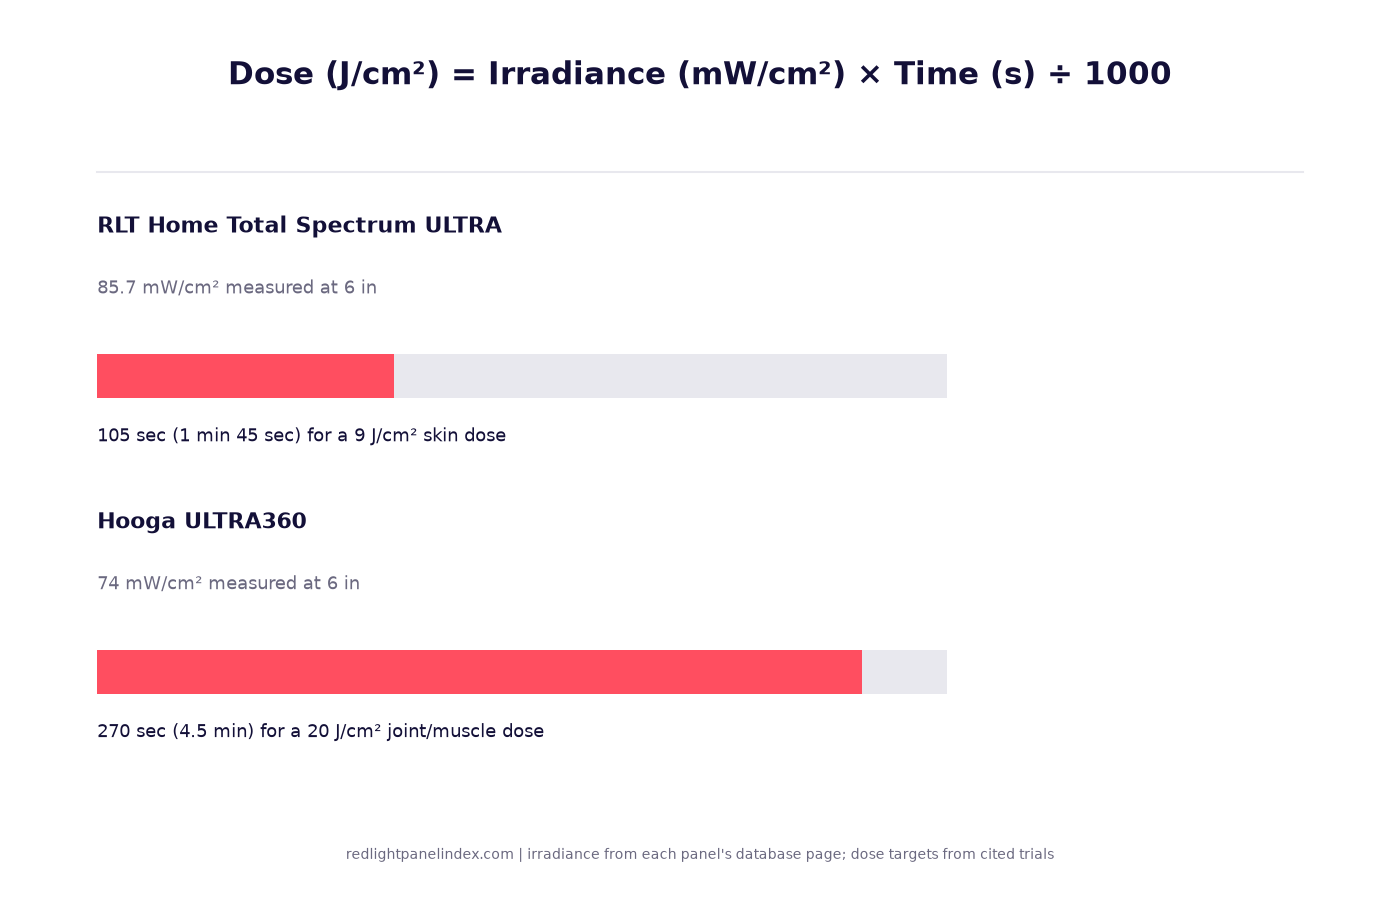
J/cm2 is irradiance times time divided by 1000. The formula, two worked examples, and the doses actually used in the trials this site cites.
Red Light Therapy Glossary: 40 Terms Explained
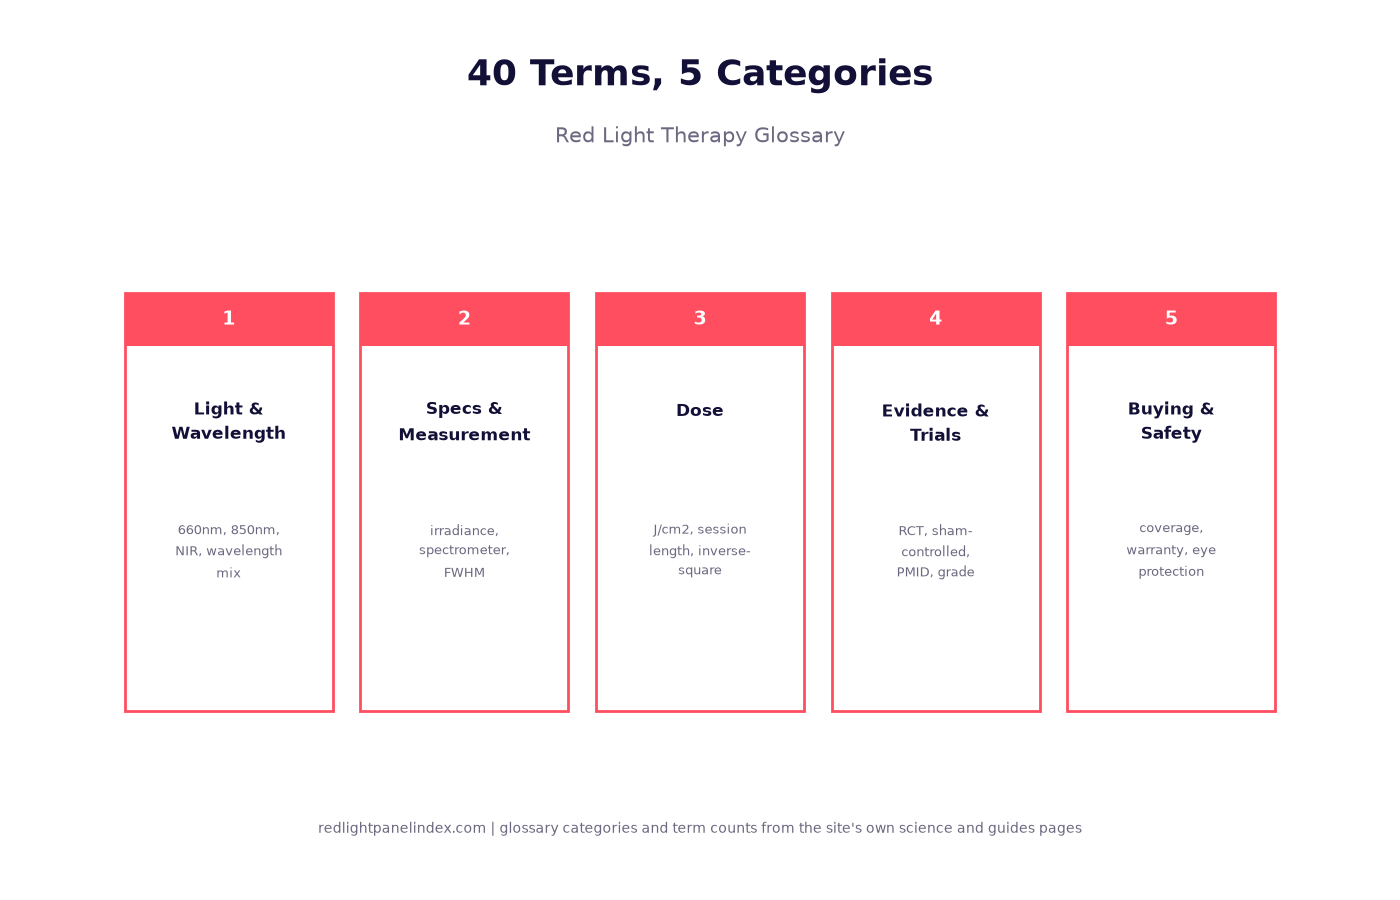
Short definitions for the wavelength, dose, spec and trial terms used across this site, each linking the full explainer page.
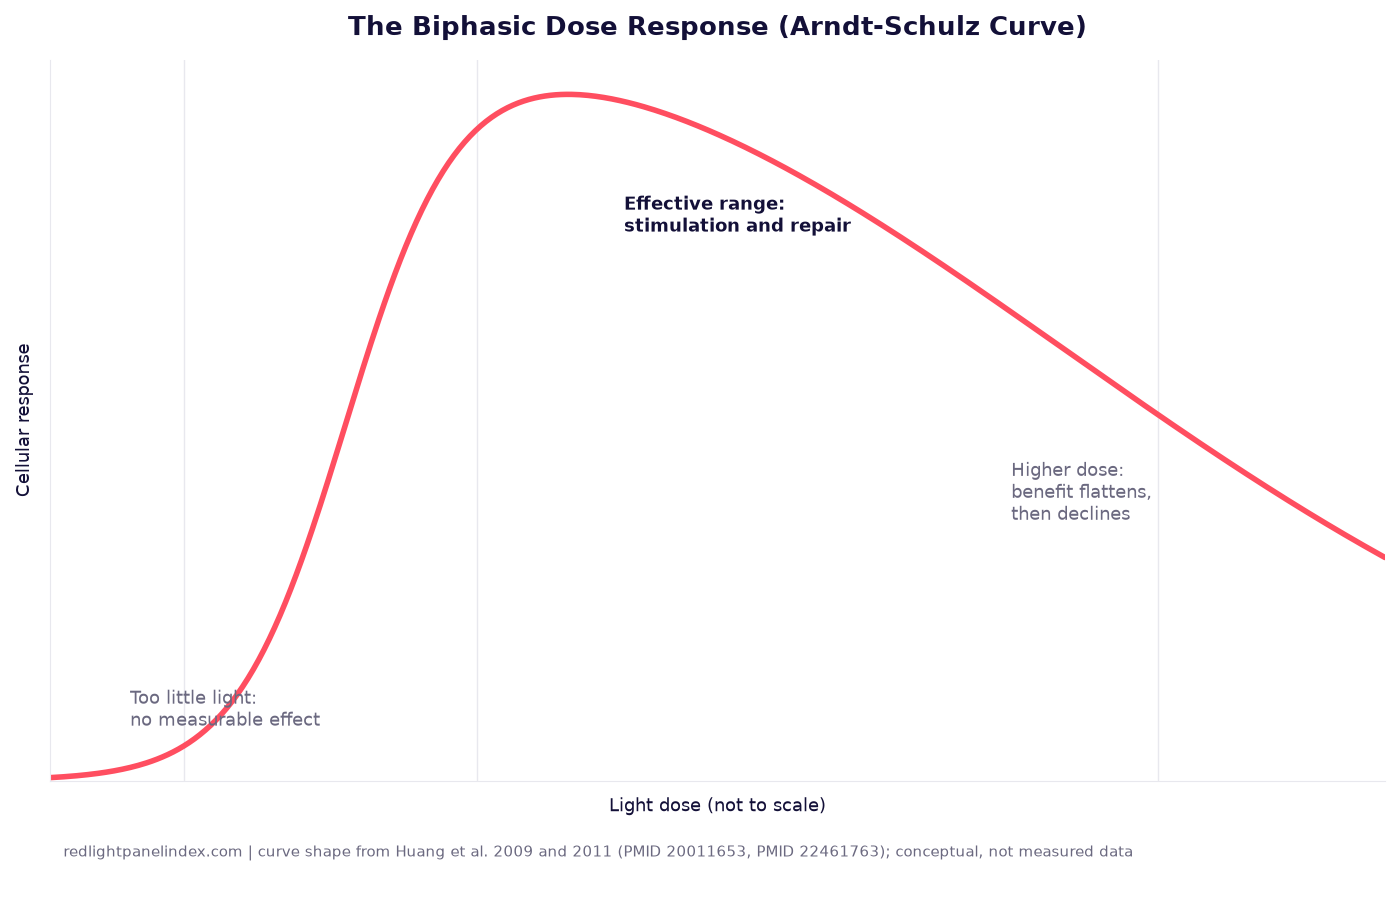
The Biphasic Dose Response: Can You Overdose on Red Light?
Two mechanistic reviews describe the Arndt-Schulz curve in light therapy - why more light does not mean a better result, and where that ceiling actually comes from.
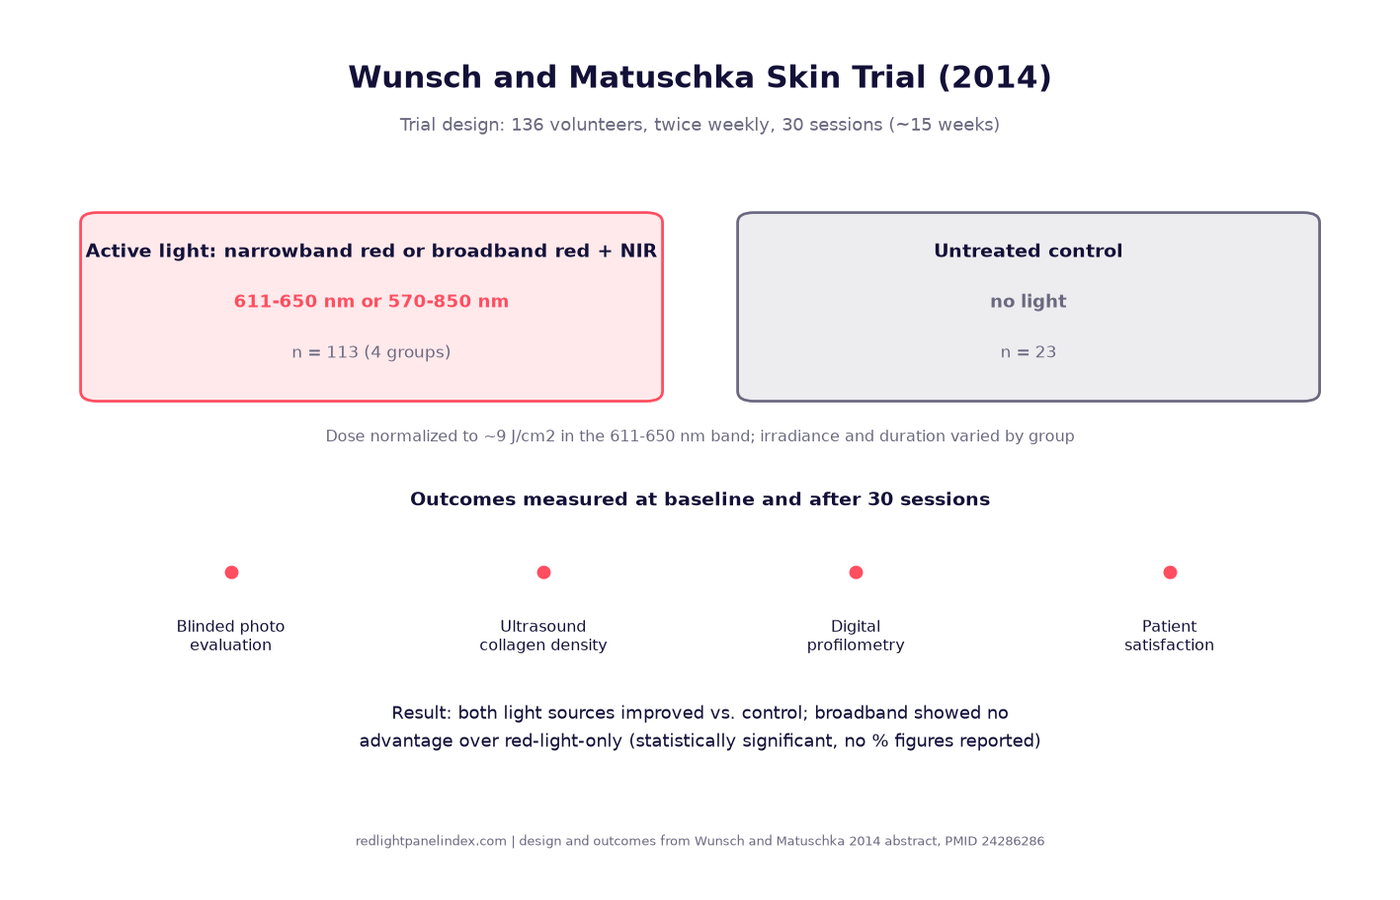
Study Review: The Wunsch Red and Near-Infrared Skin Trial
A 2014 trial treated 113 people twice weekly for 15 weeks with red and red-plus-near-infrared light and measured collagen density and skin roughness.
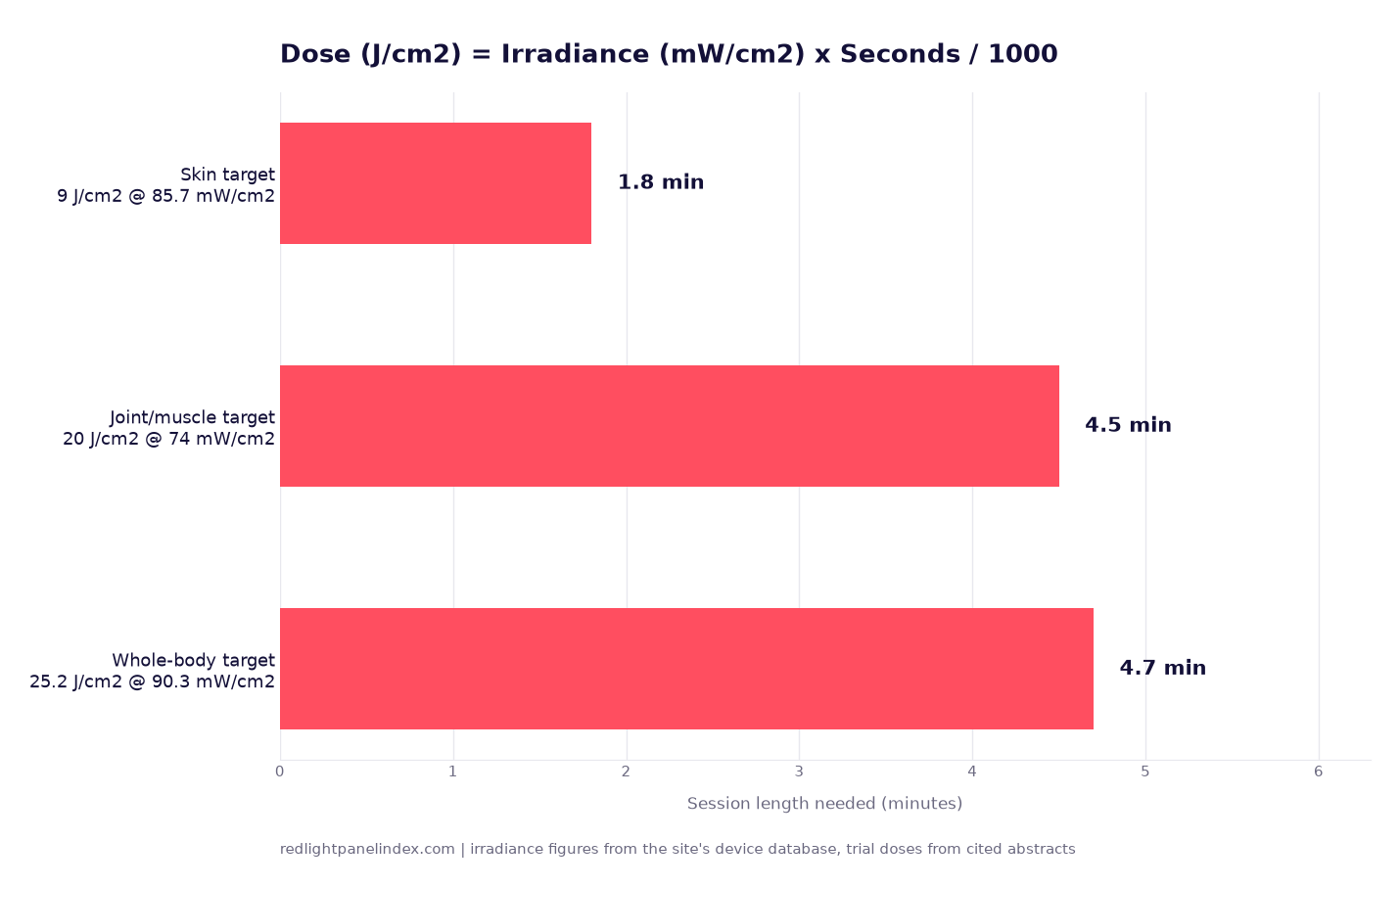
Red Light Therapy Dosing Explained: Joules Made Simple
Dose is irradiance times time. What each term means, the ranges trials actually used, and three worked examples with real panel and trial figures.
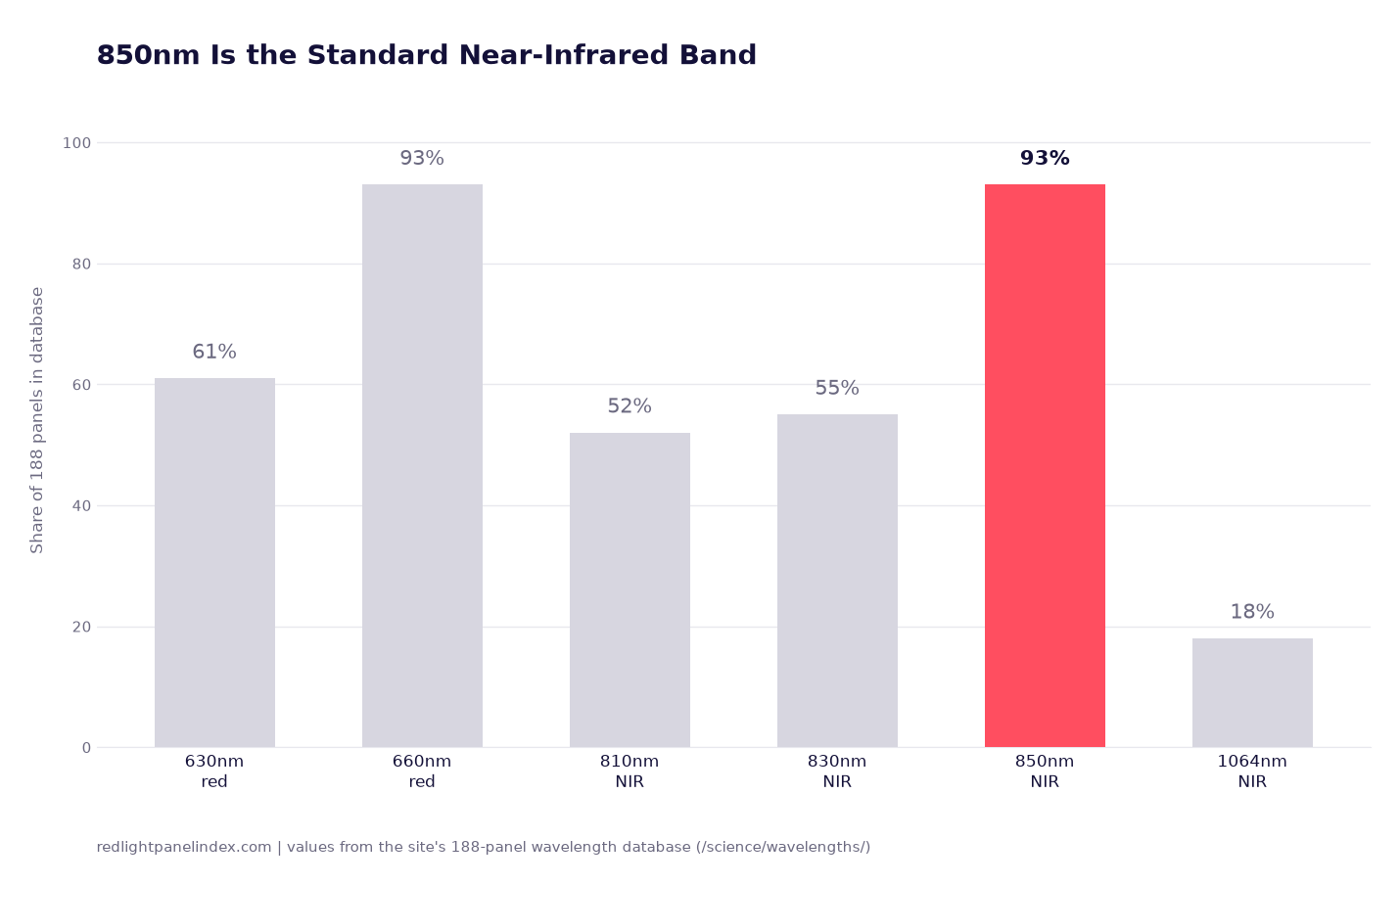
850nm Near-Infrared: The Standard NIR Band
850nm sits on 93% of red light panels, tied with 660nm. The near-infrared default, the trials behind it, and the depth it actually reaches.
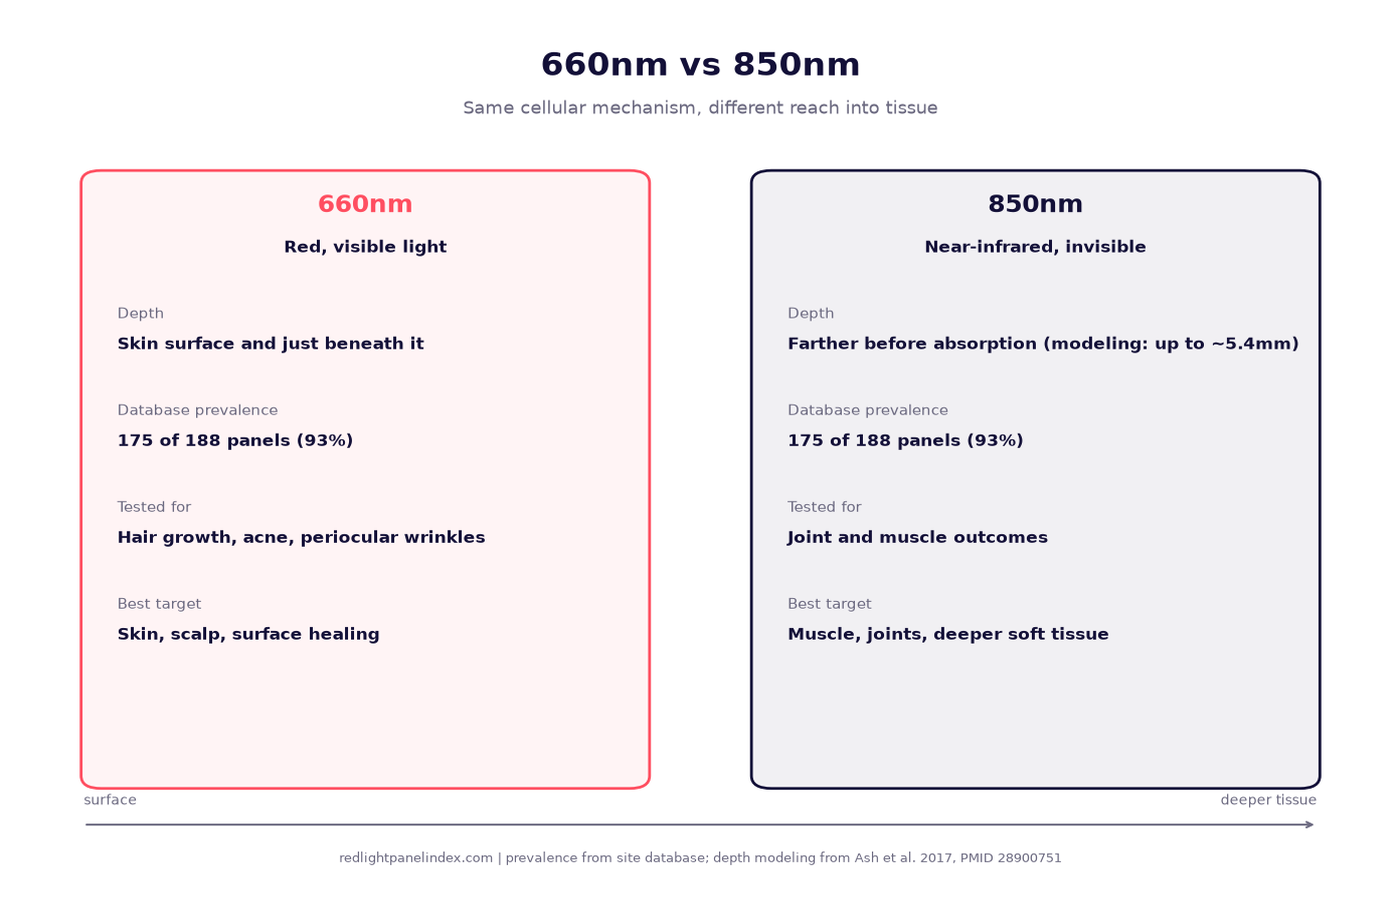
660nm vs 850nm: Which Wavelength Do You Actually Need?
The two most common panel wavelengths compared: what depth each reaches, what each was tested for, and how panels split power between them.
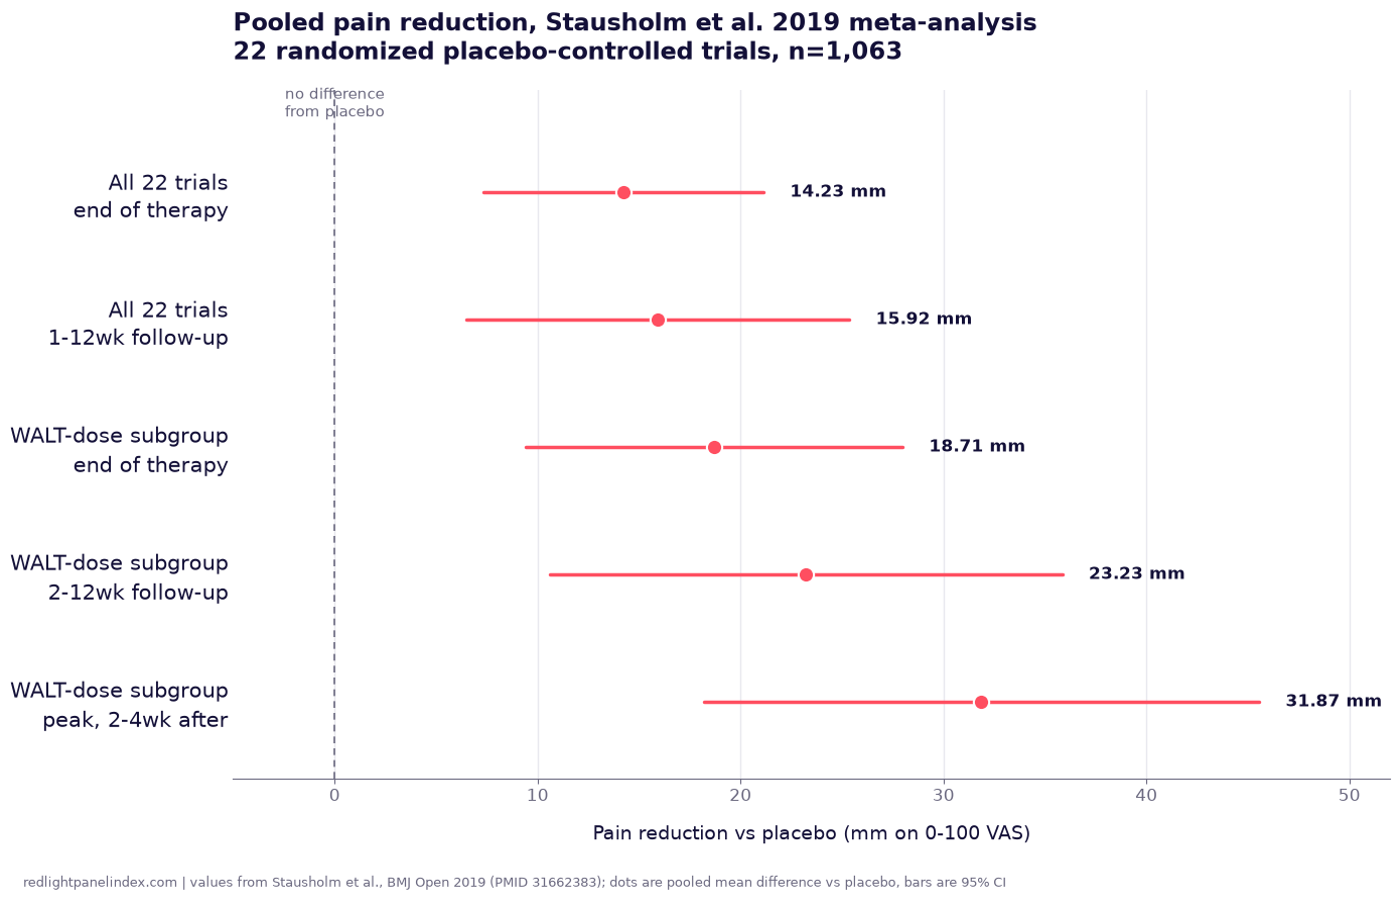
Study Review: The Stausholm Knee OA Meta-Analysis
A 2019 pooled analysis of 22 trials and 1,063 patients is the single biggest input to this site's knee osteoarthritis grade. What it pooled and found.
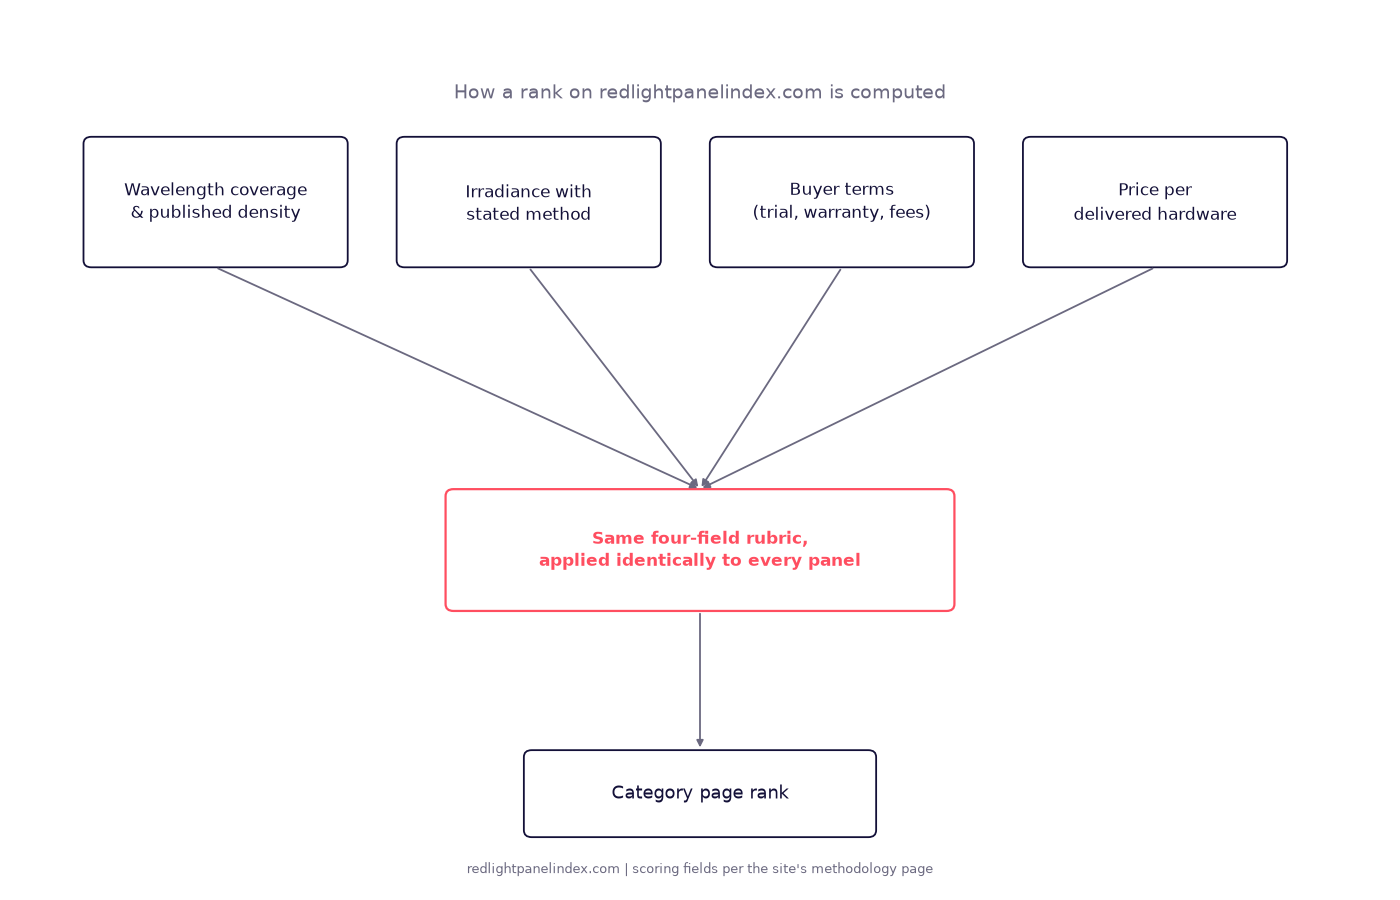
How the Rankings on This Site Are Computed
The four scoring fields behind every ranking on this site, how a method-labeled figure beats an unlabeled one, and a worked example from one list.
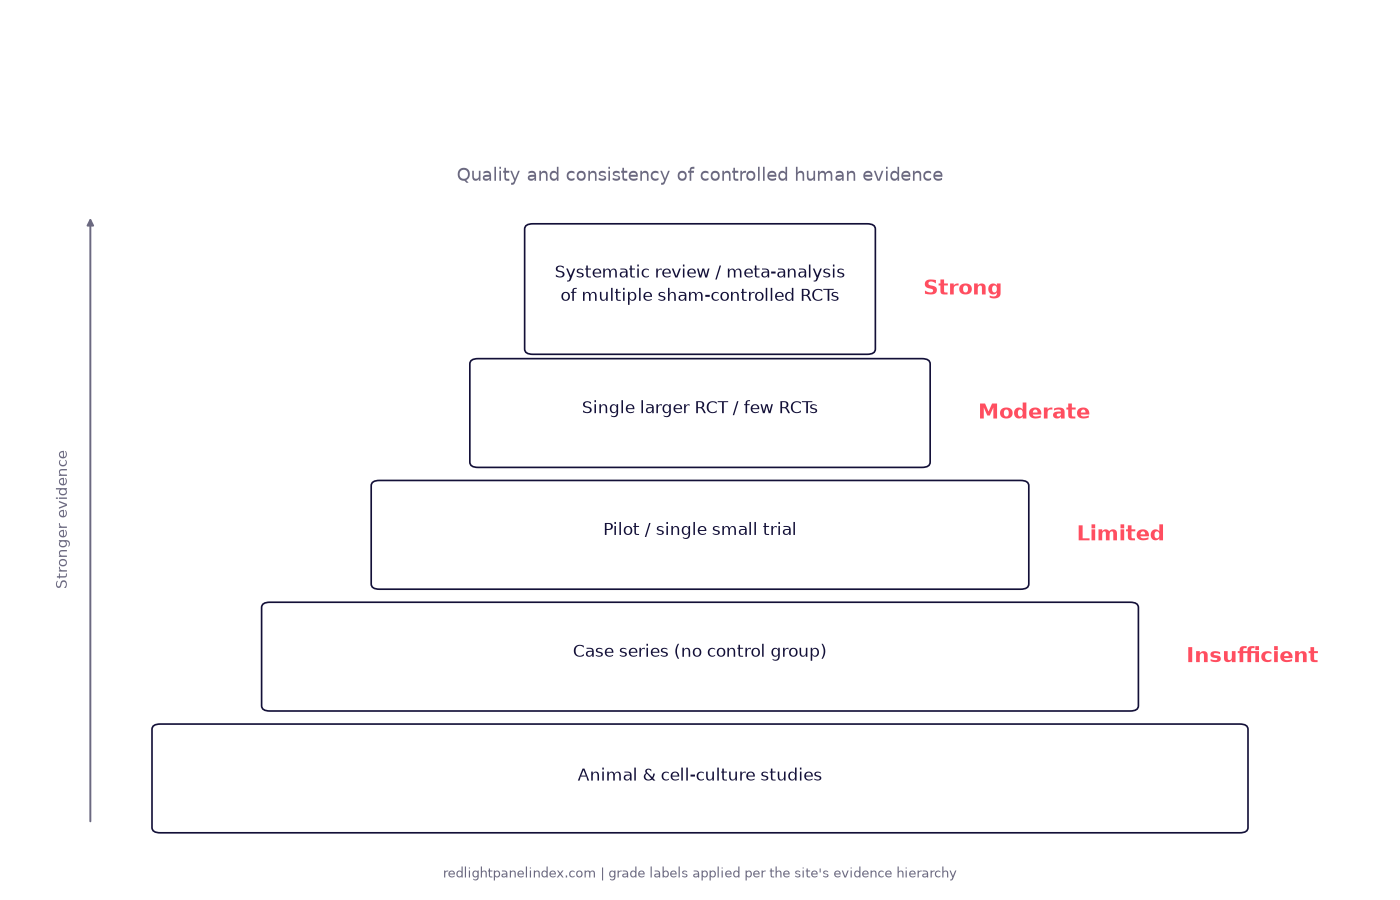
How This Site Grades Evidence: Strong to Insufficient
The four evidence grades this site uses, the trial hierarchy behind them, and one worked condition example at each grade, from knee pain to weight loss.
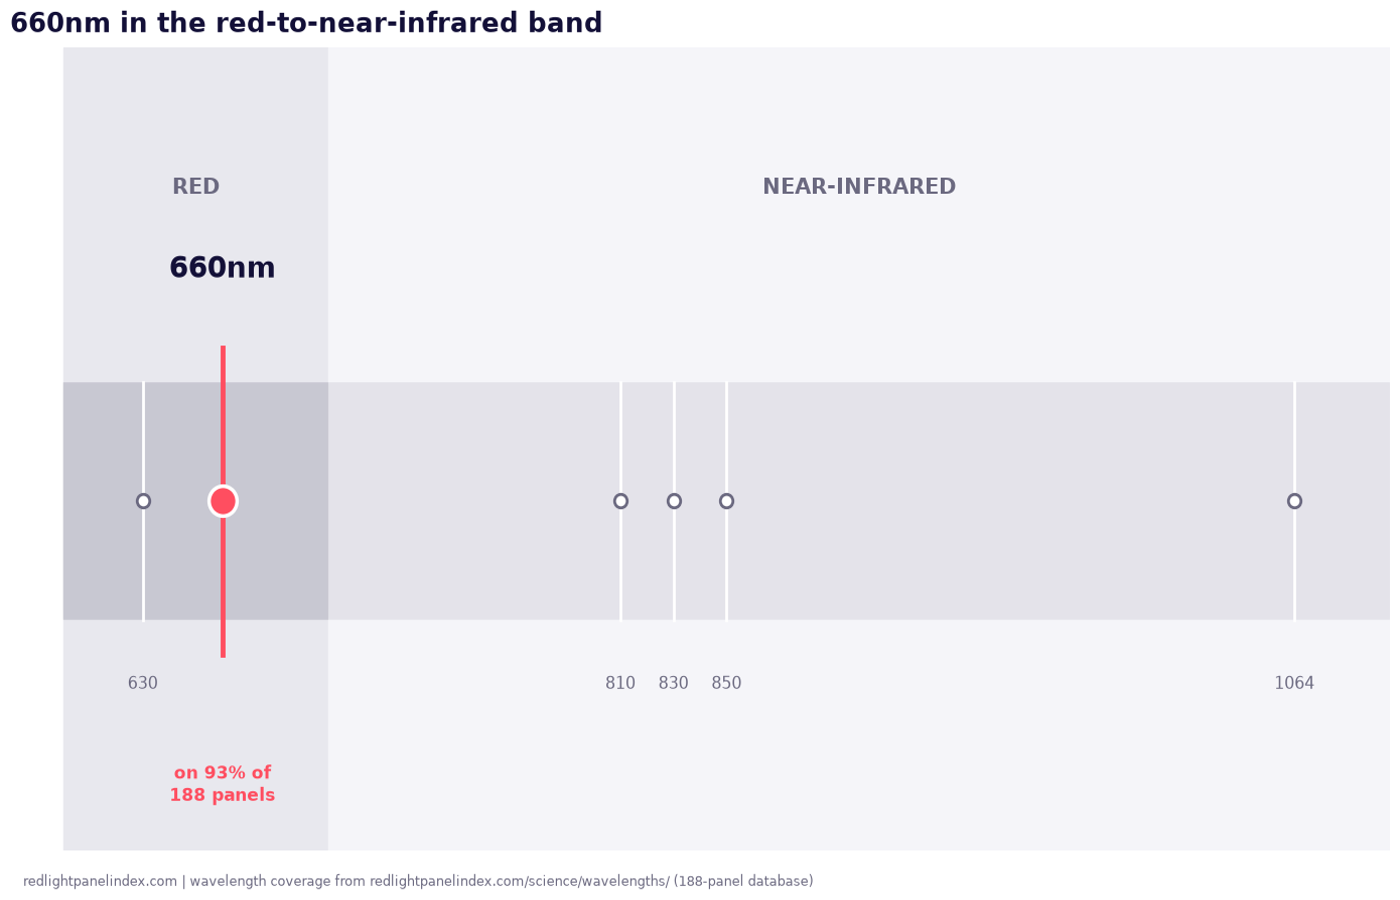
660nm Red Light: The Workhorse Wavelength
660nm sits on 93% of red light panels. What the wavelength does, the trials that used it, and how it differs from a nearby label like 655nm.
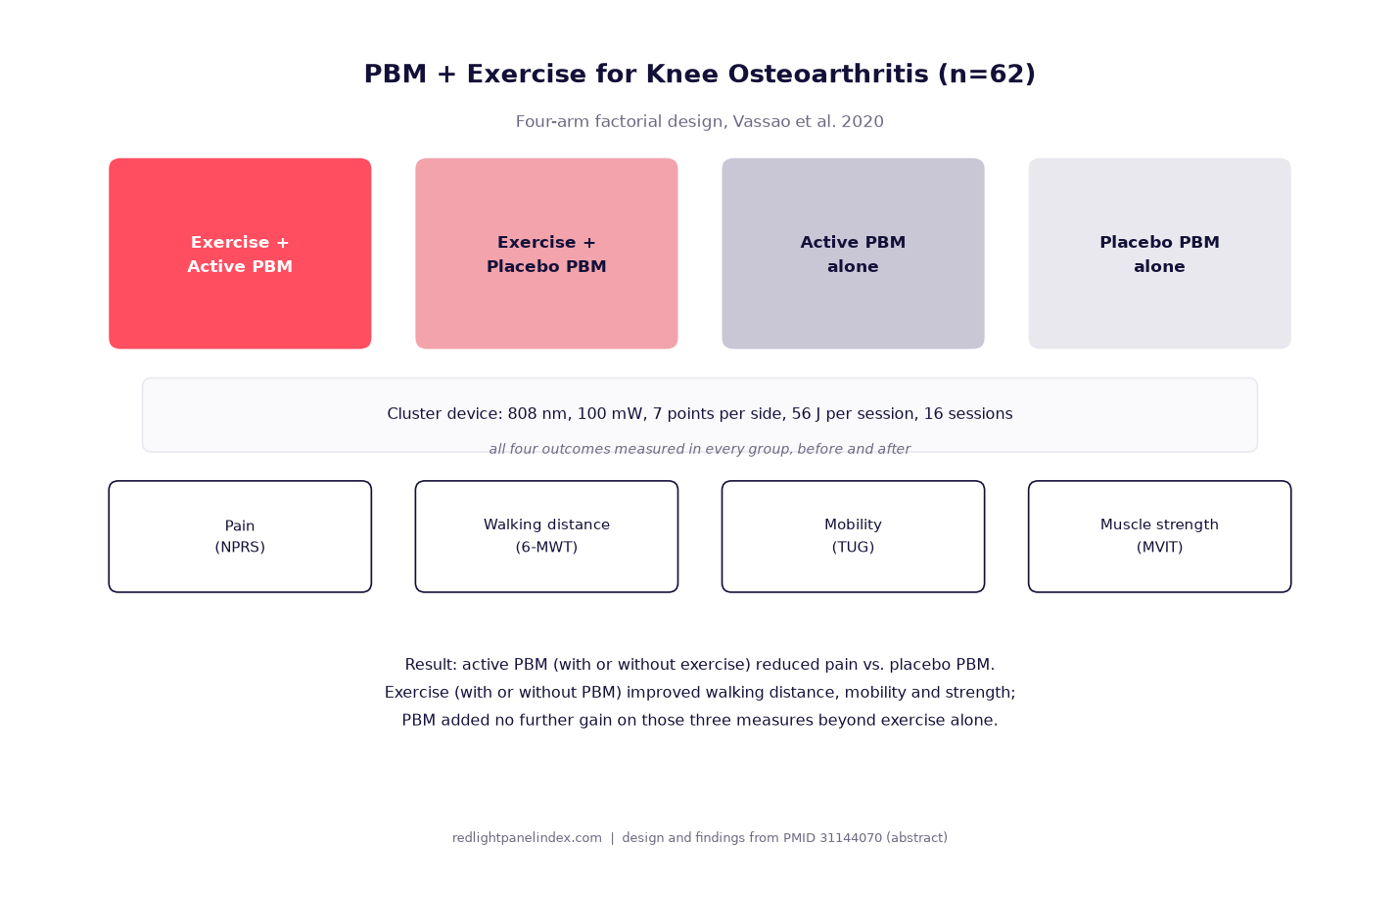
Study Review: PBM Plus Exercise for Knee Osteoarthritis
A four-arm trial tested light plus leg exercise against exercise alone in women with knee osteoarthritis. What it found, and what it did not.
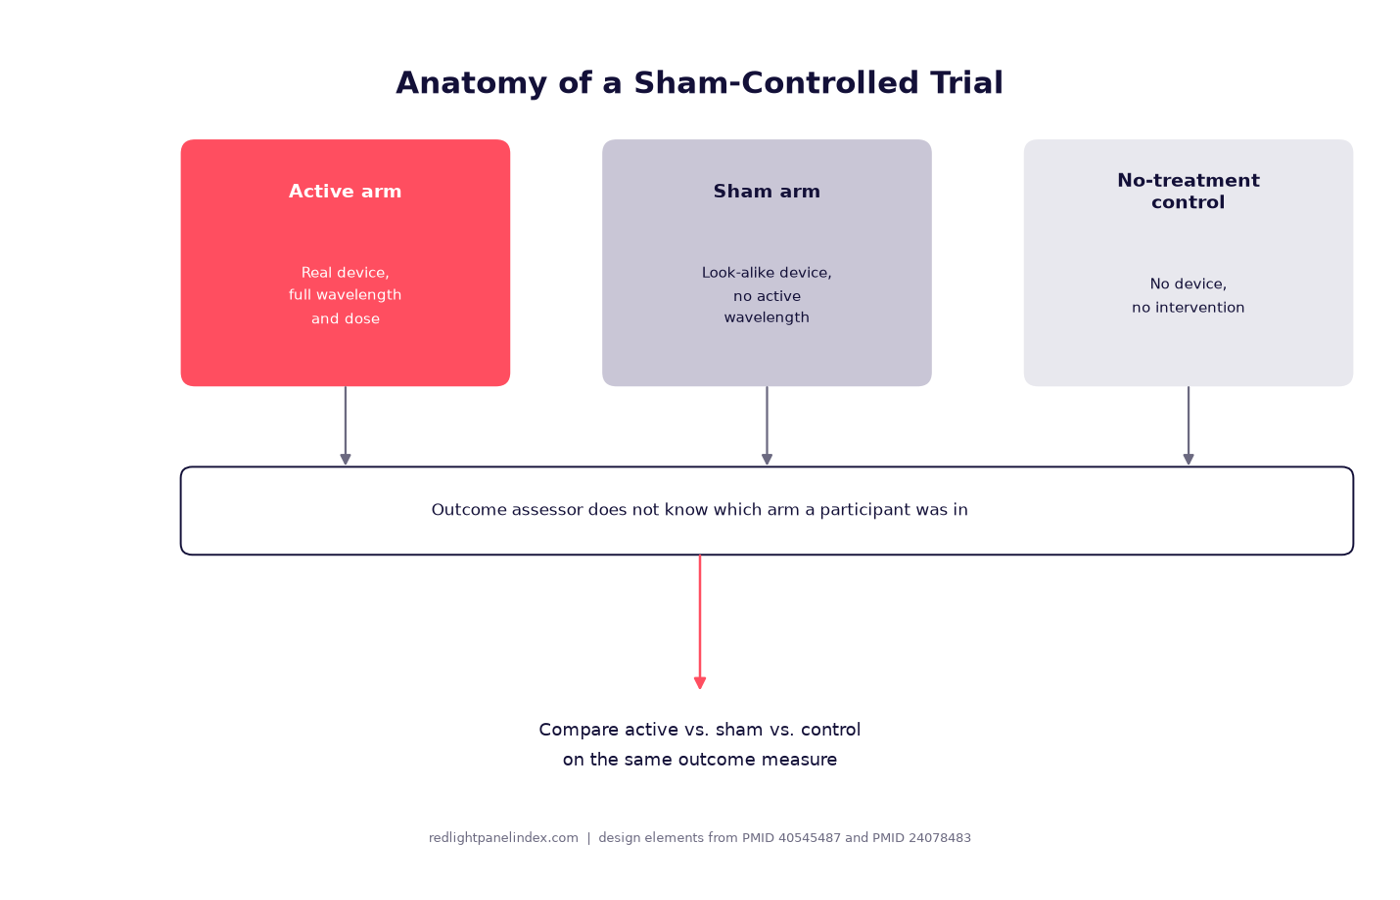
Sham-Controlled Trials: How to Read a Red Light Study
What a sham-controlled trial is, why blinding is hard when the light itself is visible, and how to read an abstract's claims against its design.
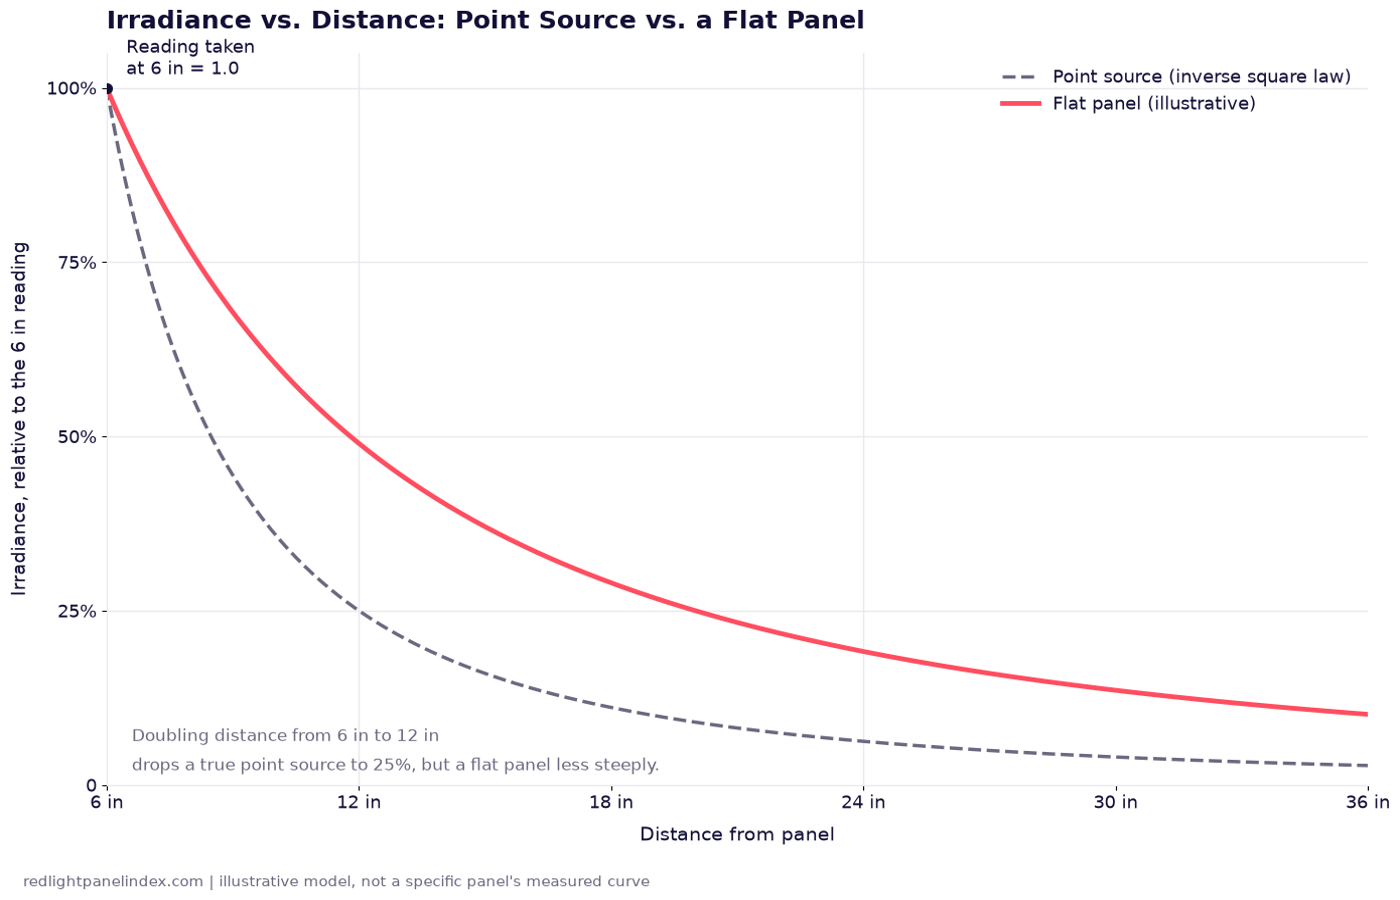
Inverse Square Law: Why It Only Half Applies
The inverse square law predicts how fast light fades with distance, but a flat panel is not a point source, so it fades slower than the law says up close.