The Science Behind the Numbers
Core explainers
Latest science articles
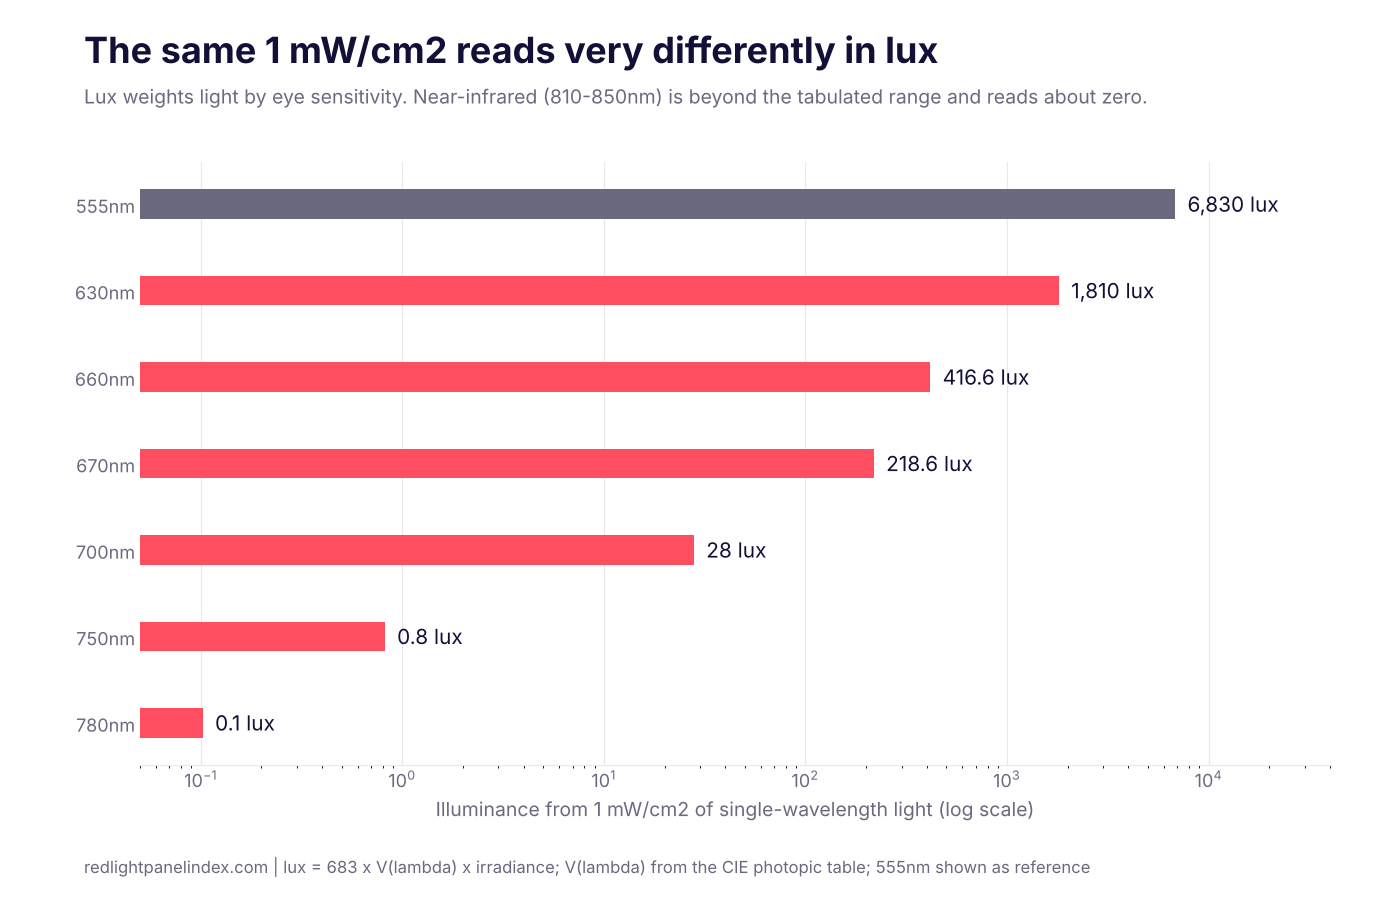
Lux vs mW/cm2: Why Lux Misreads a Red Light Panel
Lux weights light by eye sensitivity, mW/cm2 counts power. Worked examples show why near-infrared reads near zero in lux and why the units do not convert.
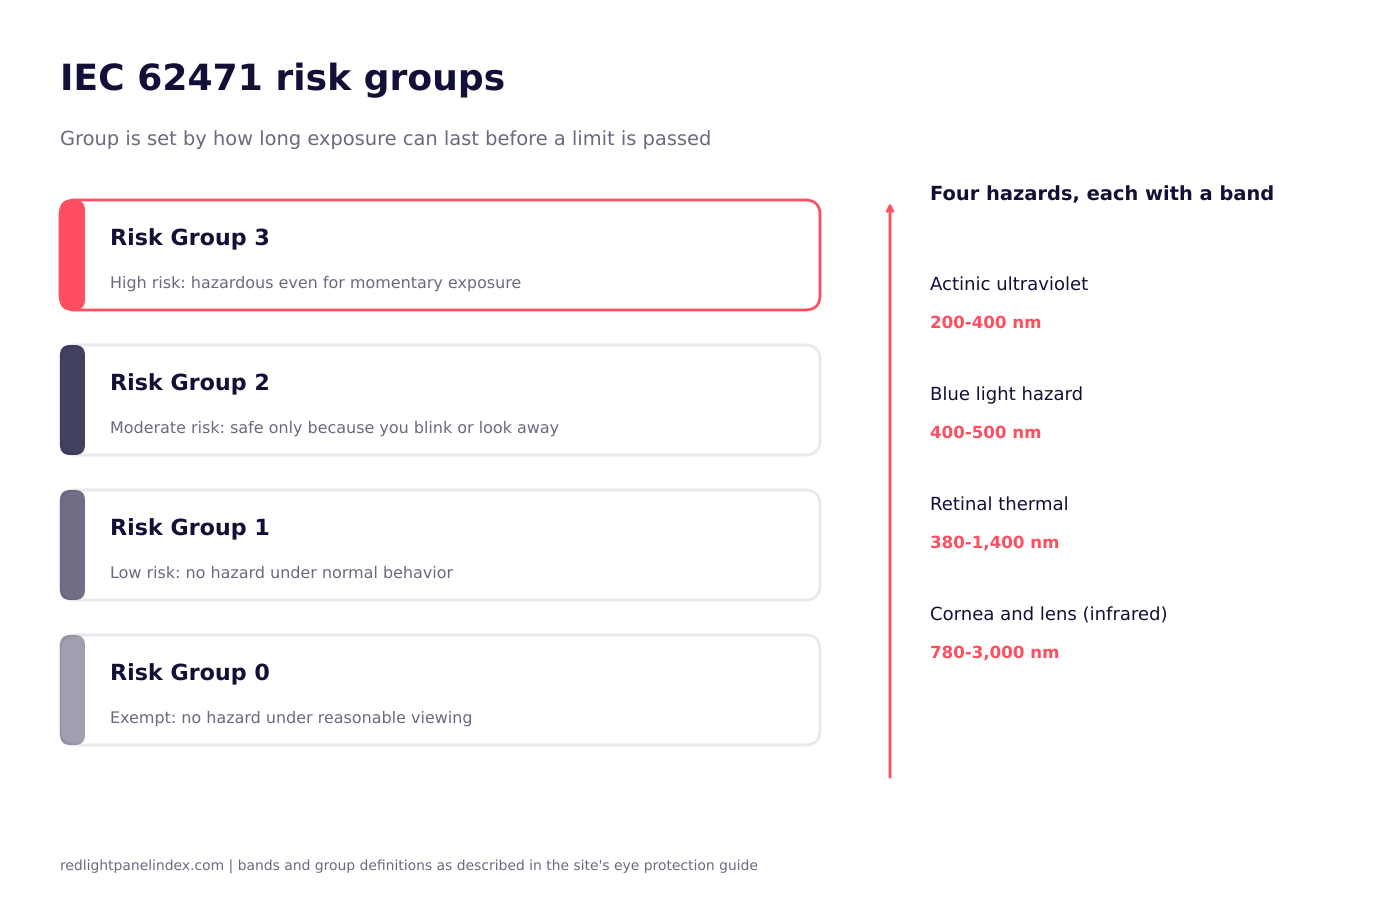
Photobiological Safety (IEC 62471): What It Covers
What the IEC 62471 eye-safety standard measures, how its four risk groups work, and why no panel brand in the database publishes a classification.
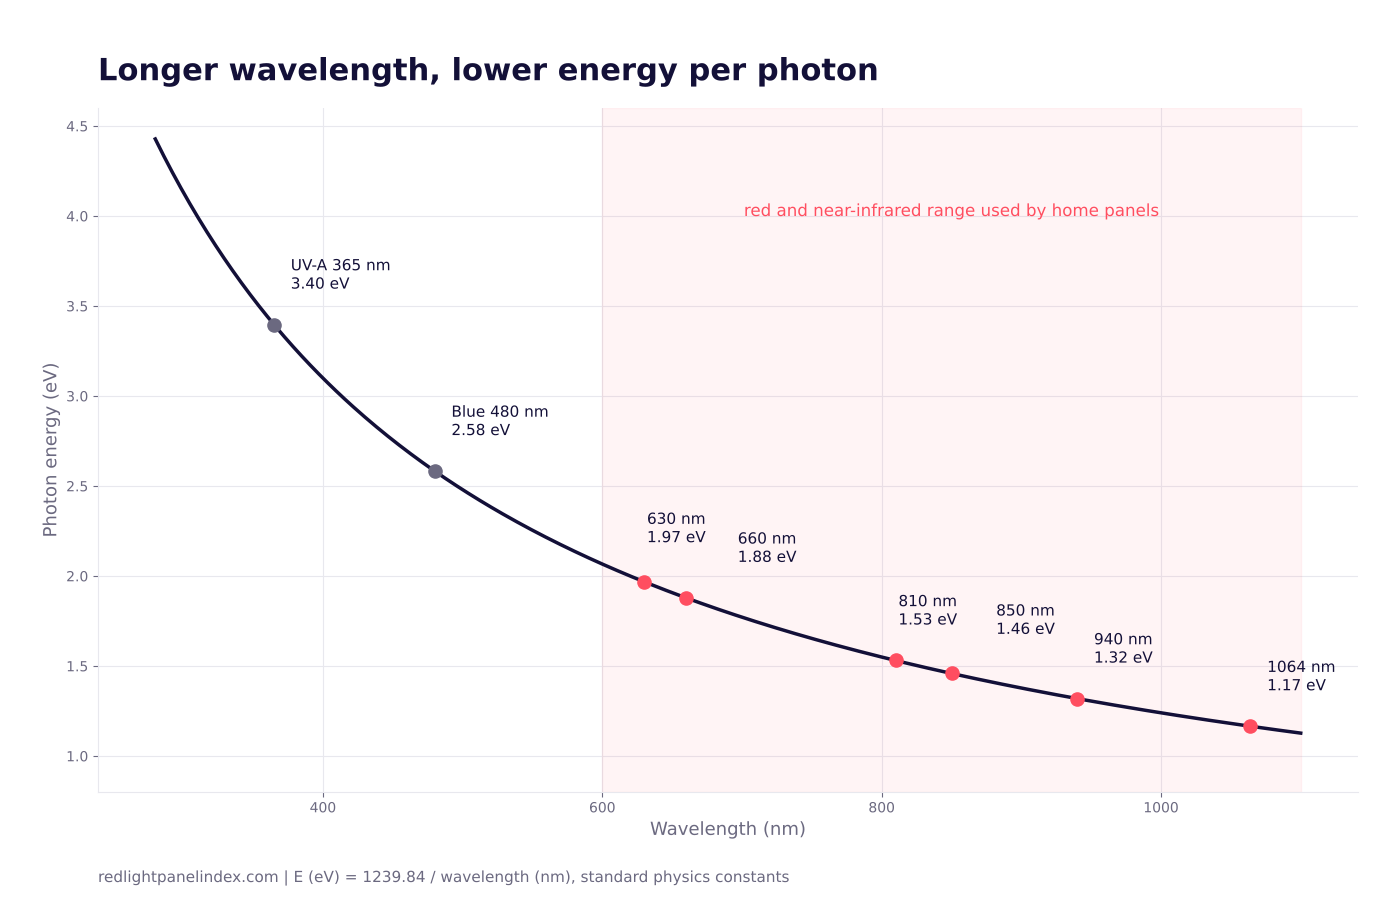
Photon Energy and Wavelength: Why NIR Photons Carry Less
Photon energy falls as wavelength rises. Here is the simple formula, worked values for common panel wavelengths, and why more energy per photon is not the goal.
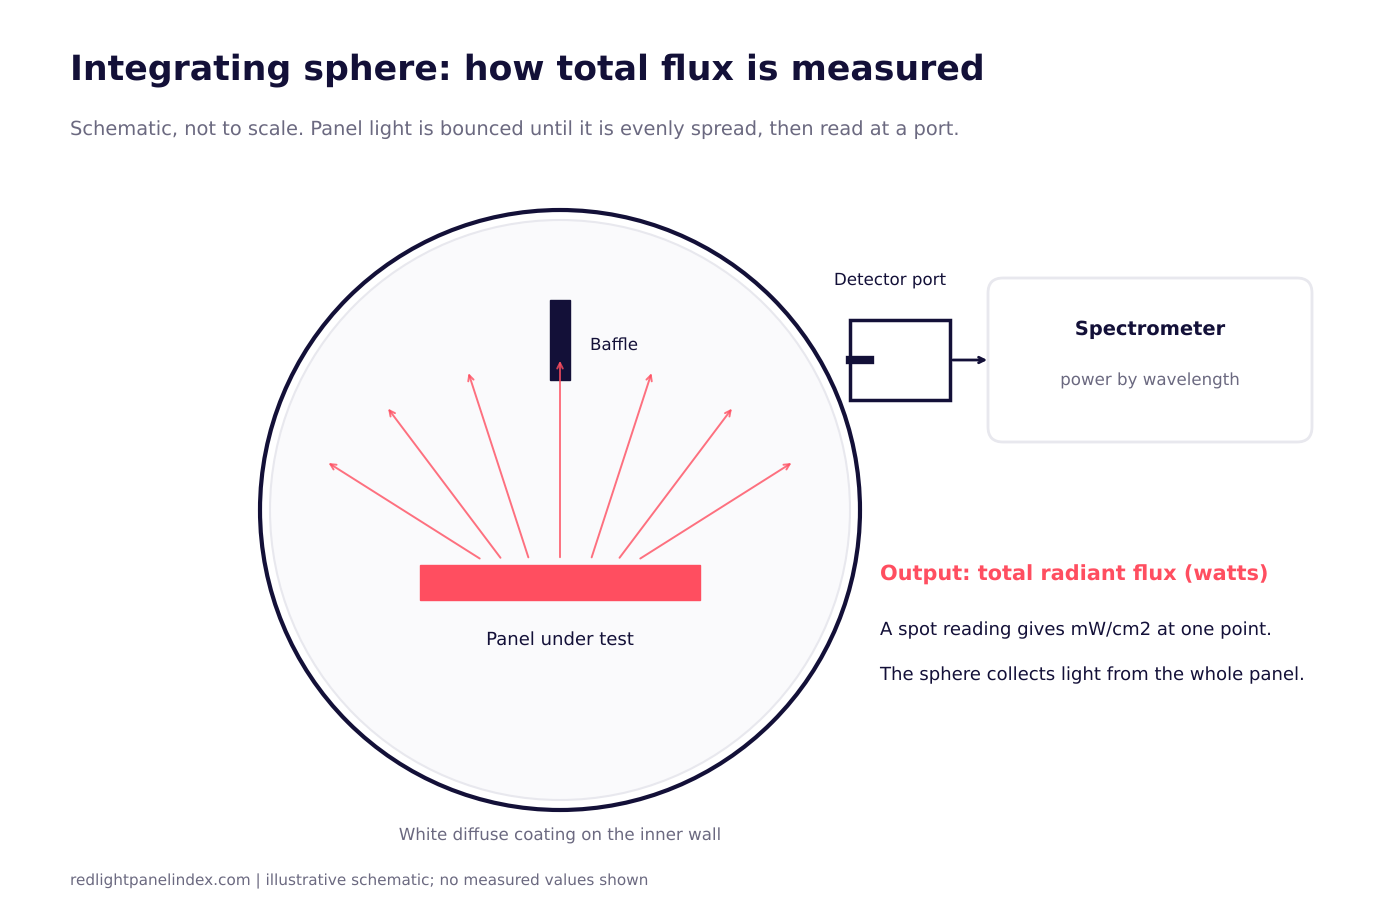
Integrating Spheres and Lab Testing of LED Panels
How an integrating sphere measures a panel's total radiant flux, why that differs from a spot irradiance reading, and what a proper test report shows.
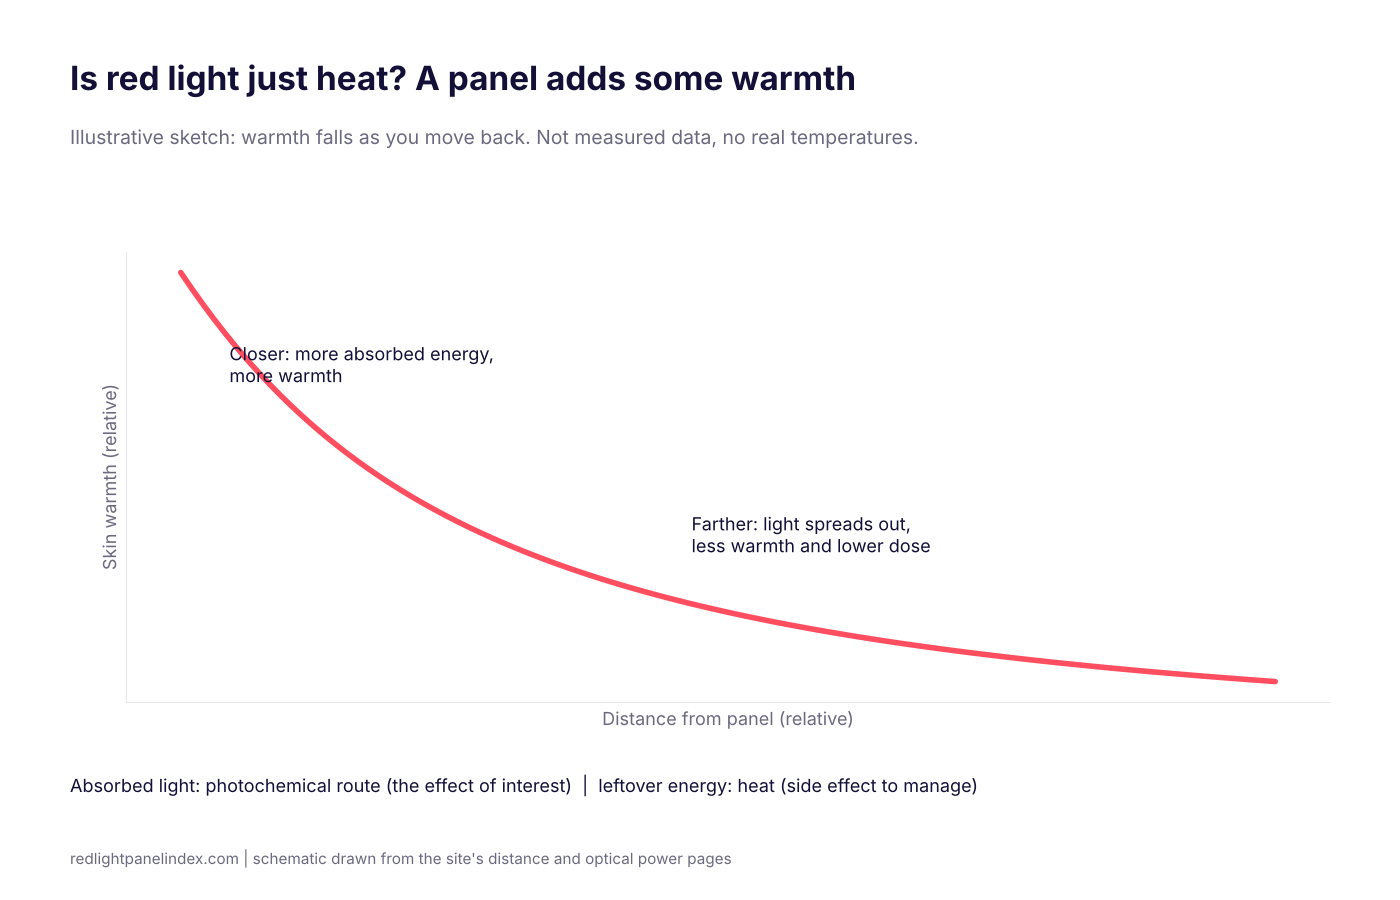
Thermal vs Photochemical: Is Red Light Just Heat?
Red light therapy is defined by light absorbed by cells, not by warming tissue. How much warmth a panel adds, and when heat becomes a confounder or a hazard.
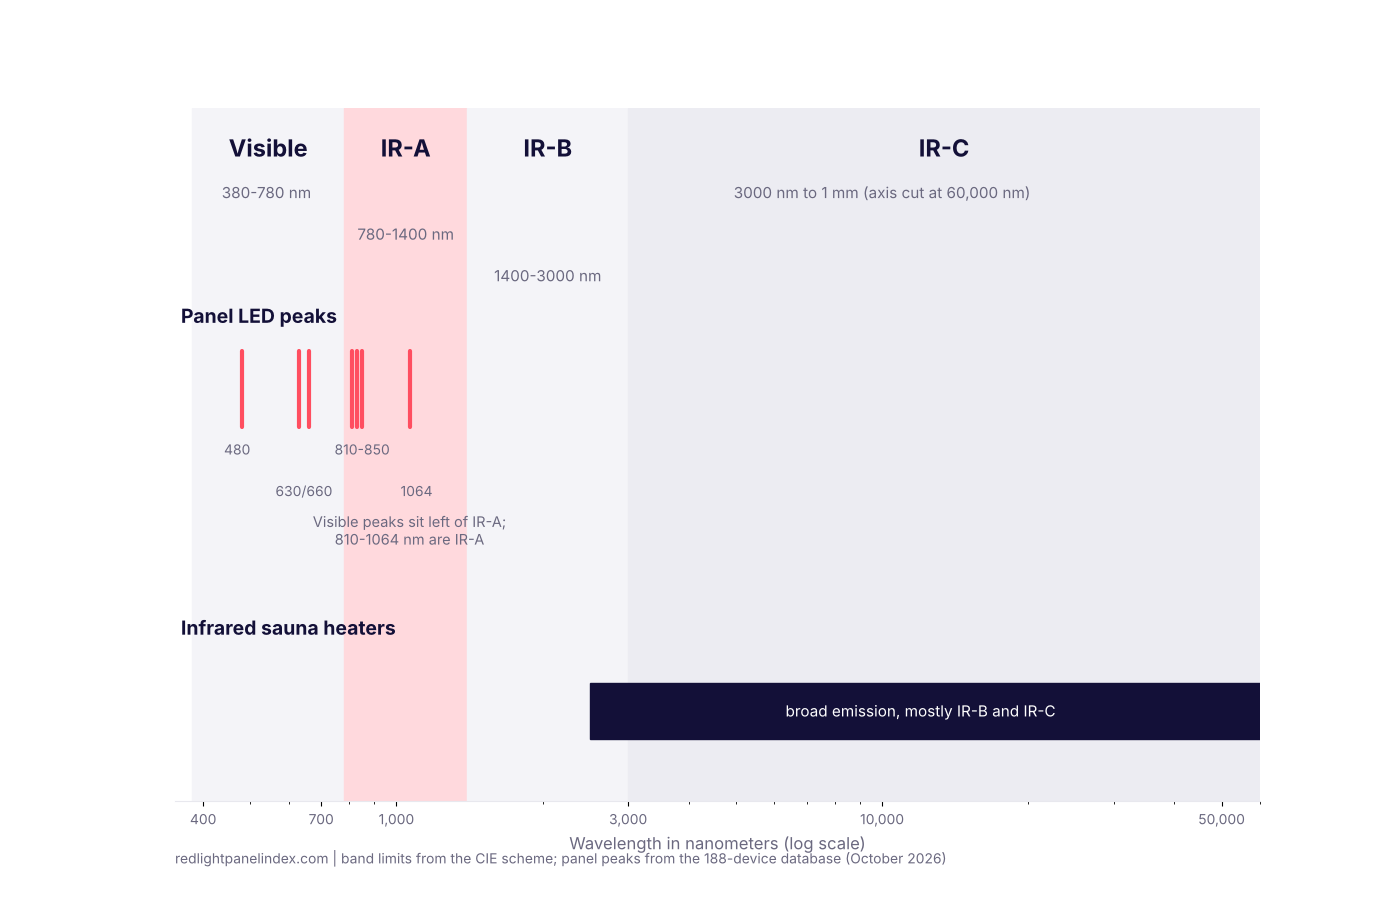
IR-A, IR-B and IR-C: Which Infrared Band Do Panels Use?
Infrared is split into three bands by wavelength. Red light panels sit in IR-A, infrared saunas sit in IR-B and IR-C. What the labels mean and how to read them.
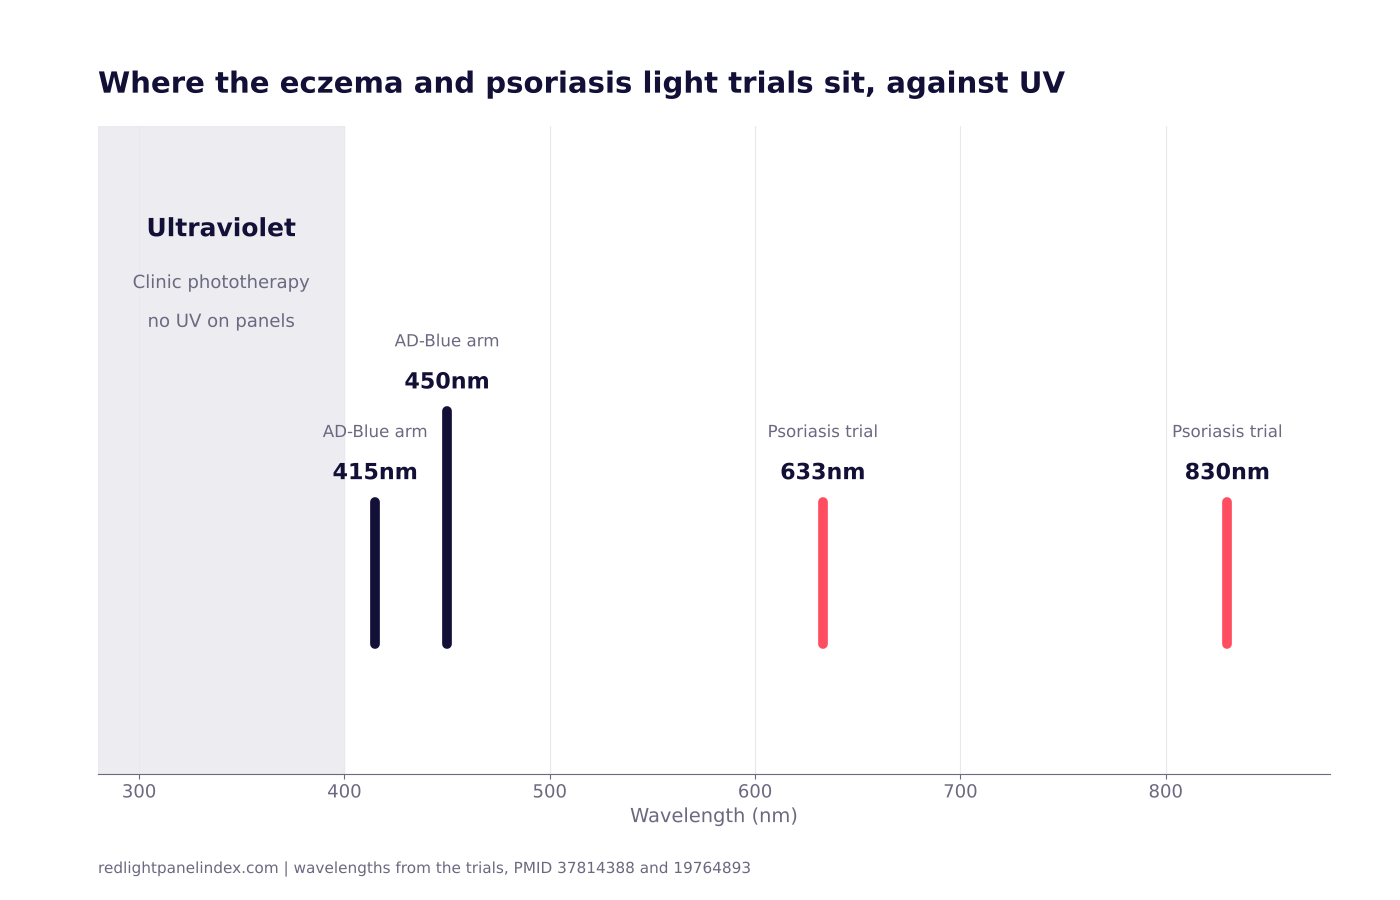
Red Light vs UV Phototherapy for Skin Conditions
Clinic UV phototherapy and home red or near-infrared panels are different treatments with different evidence. What each is, what the trials show, and what to expect.
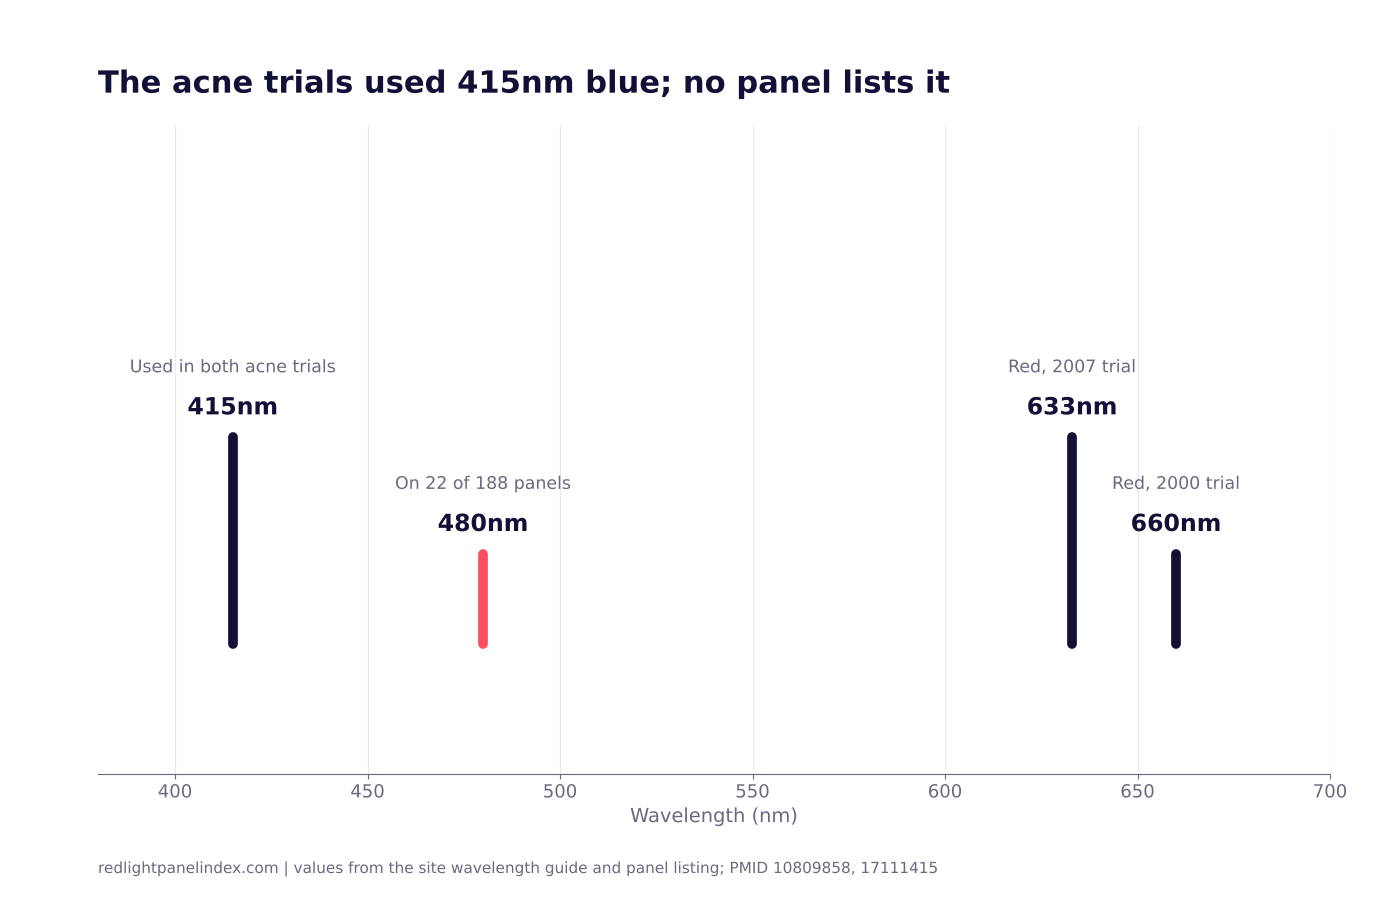
480nm Blue Light on Red Light Panels, Explained
What the 480nm blue channel on some red light panels is, how little of the output it takes, why the acne trials used 415nm instead, and what to check.
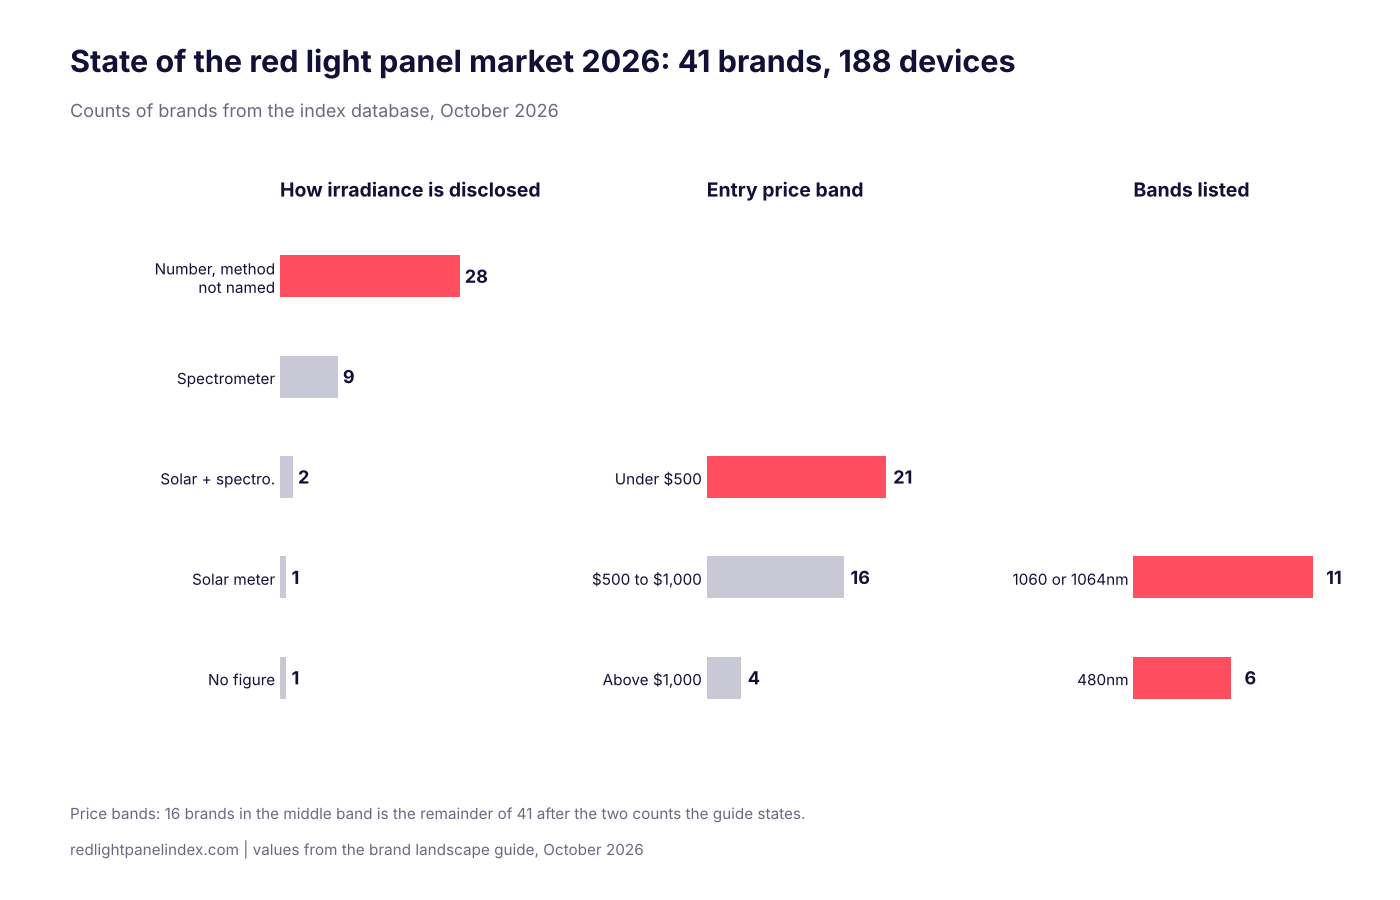
State of the Red Light Panel Market 2026
Price bands, wavelength counts, disclosure rates, 1064nm adoption and warranty terms across 41 brands and 188 devices, taken from the index database in 2026.
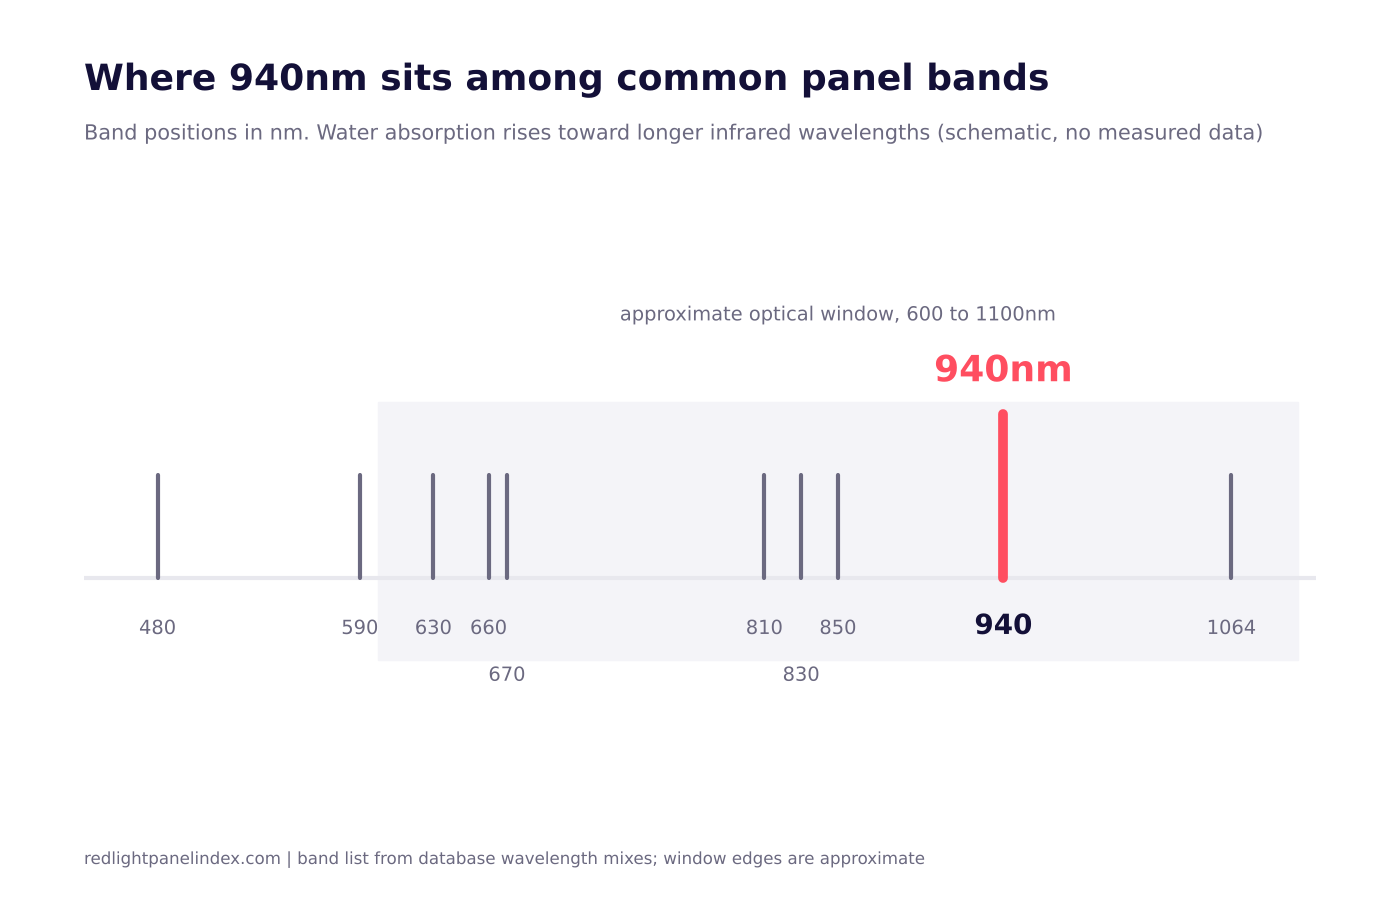
940nm Near-Infrared: The Less Common NIR Band
What 940nm is, where it sits against 850nm and 1064nm, what the muscle soreness evidence says about it, and which database panels include the band.
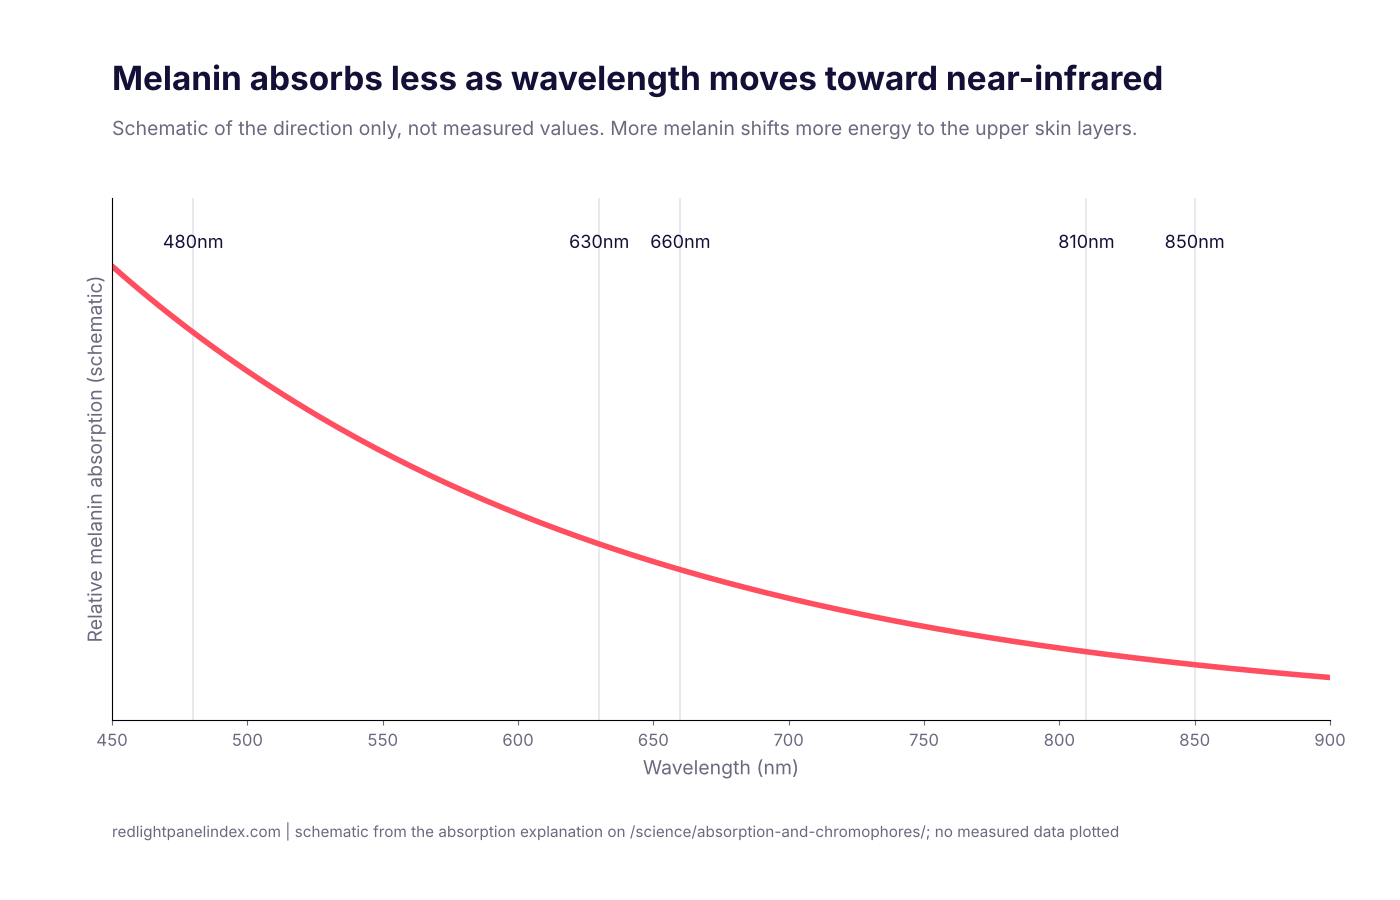
Skin Phototype and Red Light Dosing: Does Tone Change It?
Melanin competes for red light in the upper skin layers. What the skin reviews and the phototype IV acne trial say, and cautious guidance for home dosing.
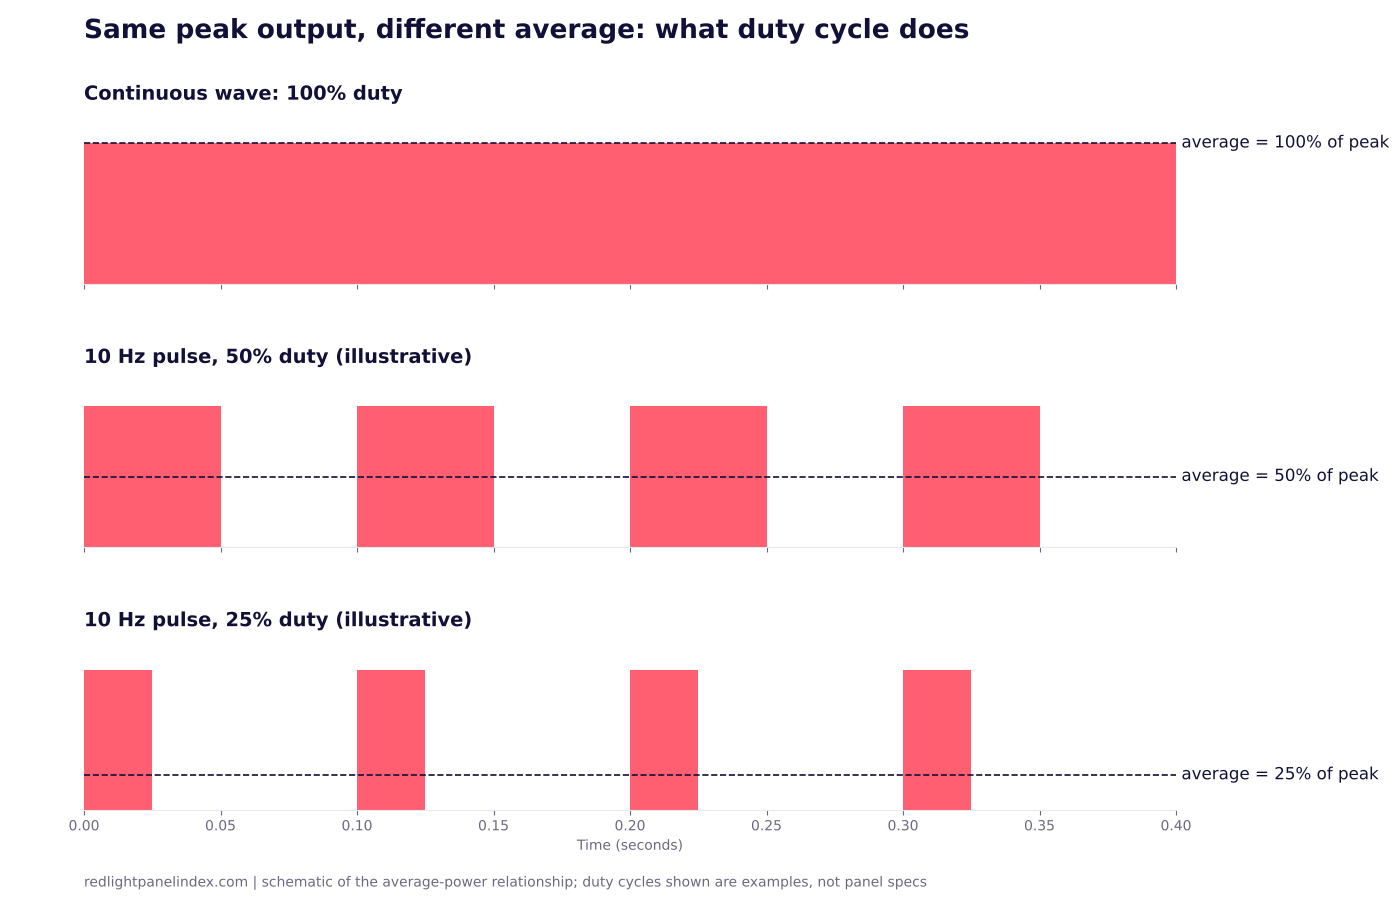
Duty Cycle and Pulse Frequency on Red Light Panels
Pulse frequency is how often a panel's LEDs switch on per second; duty cycle is how long each pulse stays on. Here is how both change average dose.
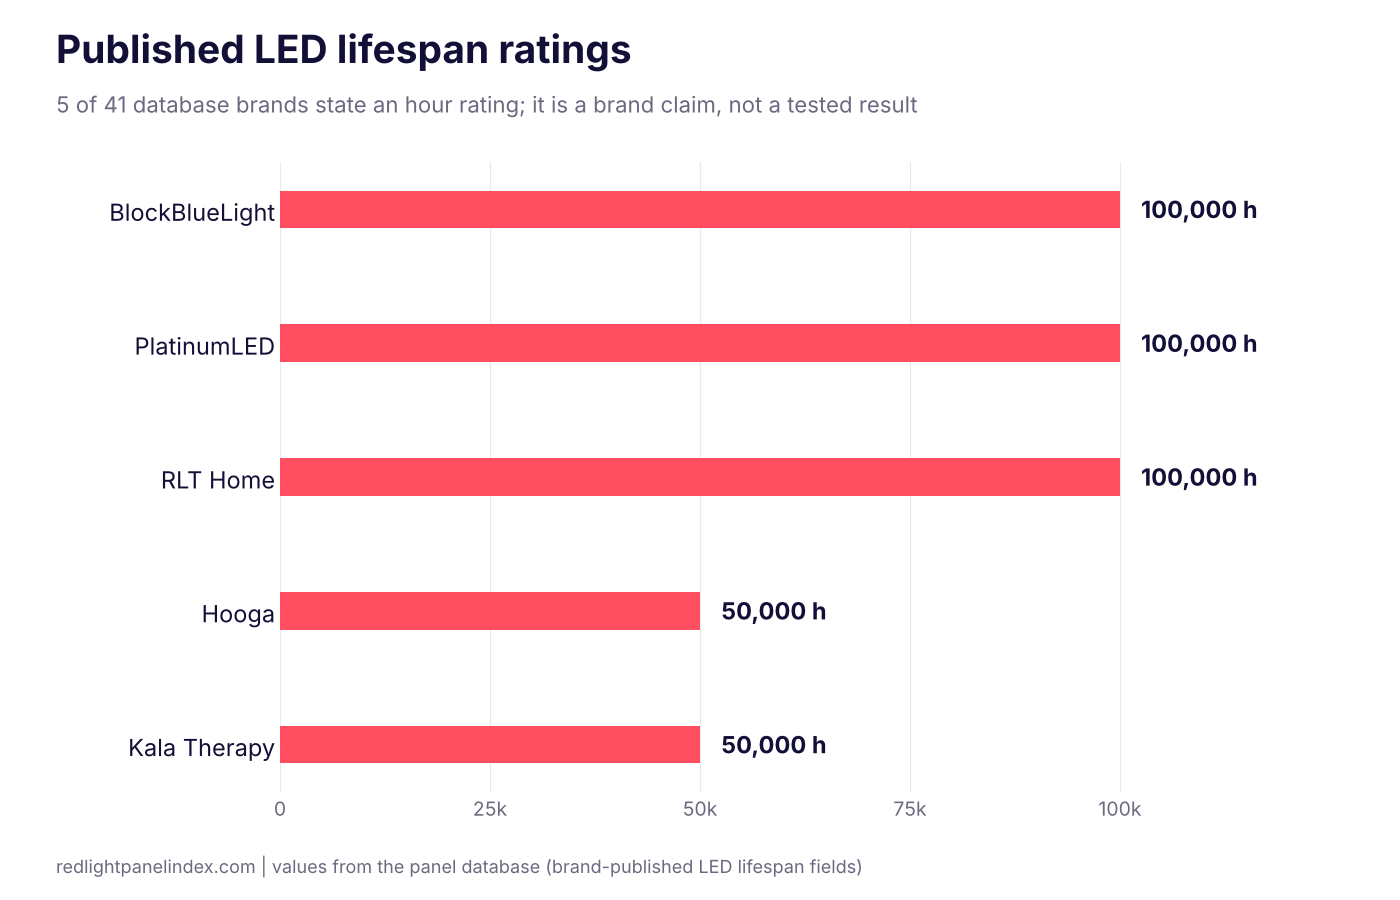
How Long Do Red Light Panels Last? LED Hours
What a 50,000 or 100,000 hour LED rating means, why heat decides real-world output, and what warranty terms tell you about how long a panel lasts.
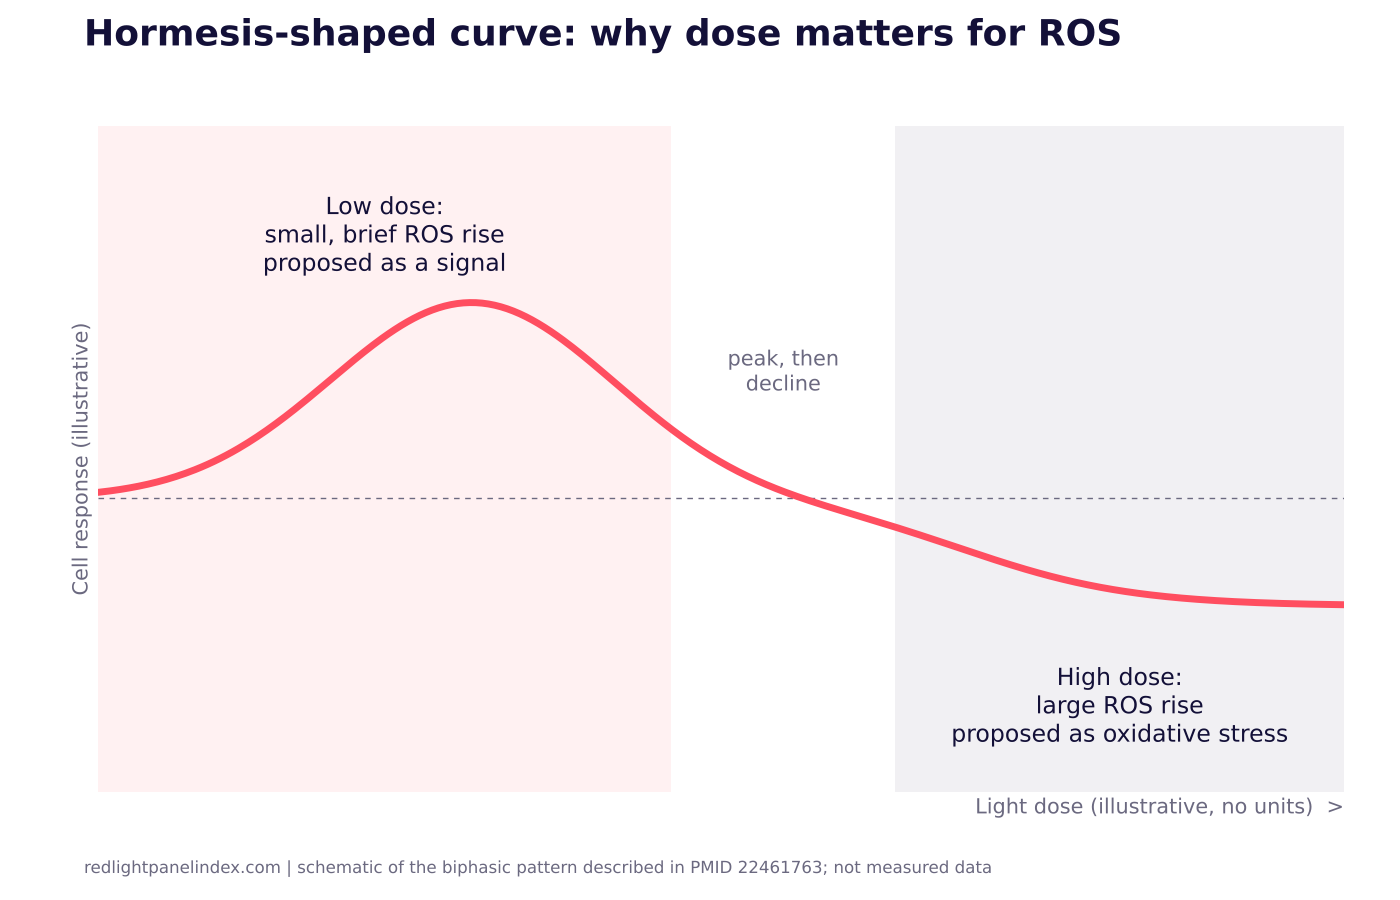
Reactive Oxygen Species and Hormesis in Red Light
How small, short-lived reactive oxygen species may act as signals after red light, why high doses may flip that, and what it means for session length.
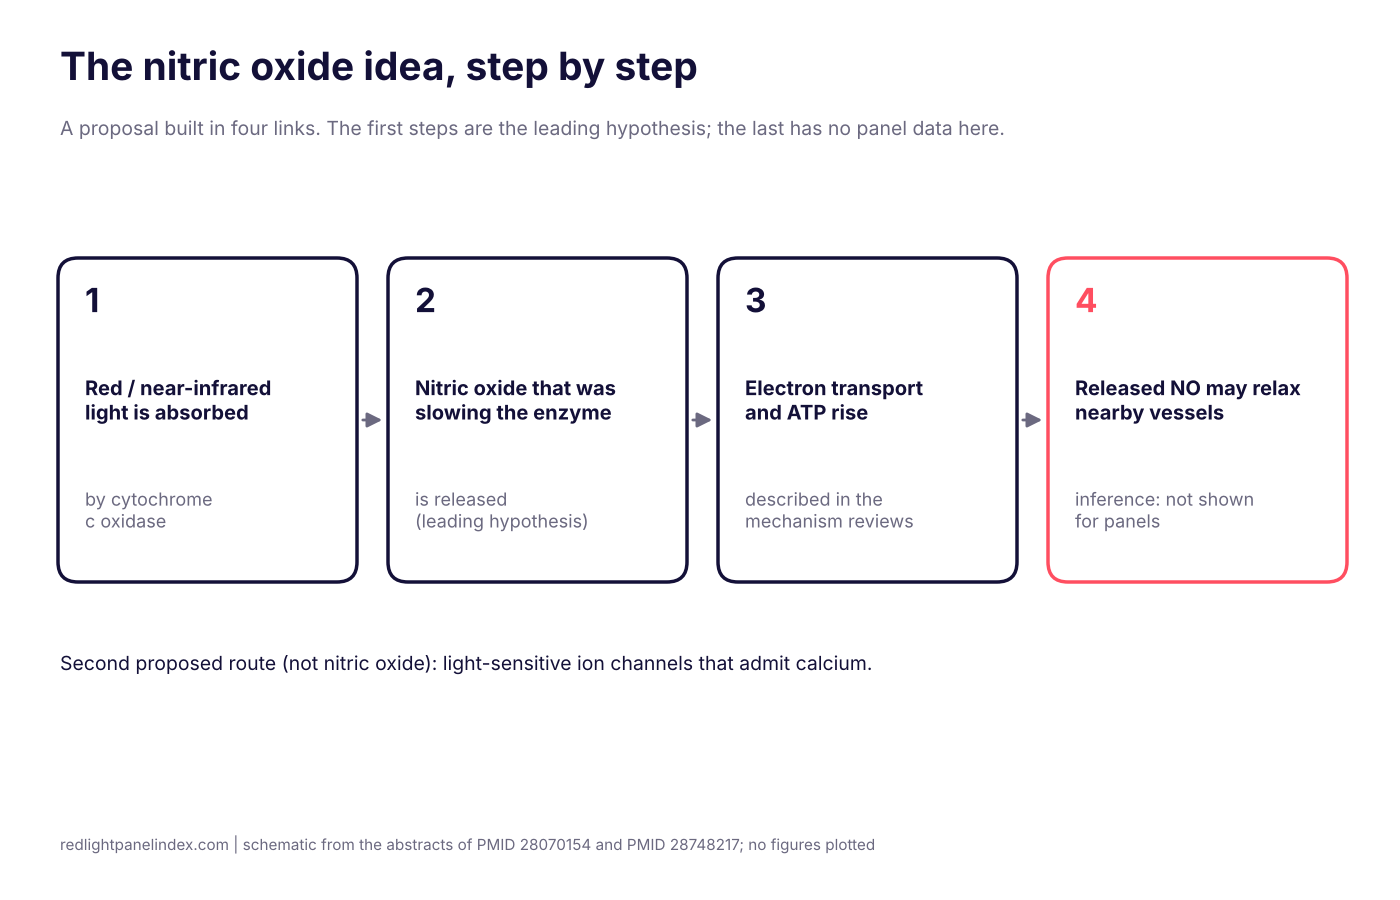
Nitric Oxide and Red Light: The Blood-Flow Idea
The proposal that light frees nitric oxide from cytochrome c oxidase, why it suggests better blood flow, and how little of it is shown in people.
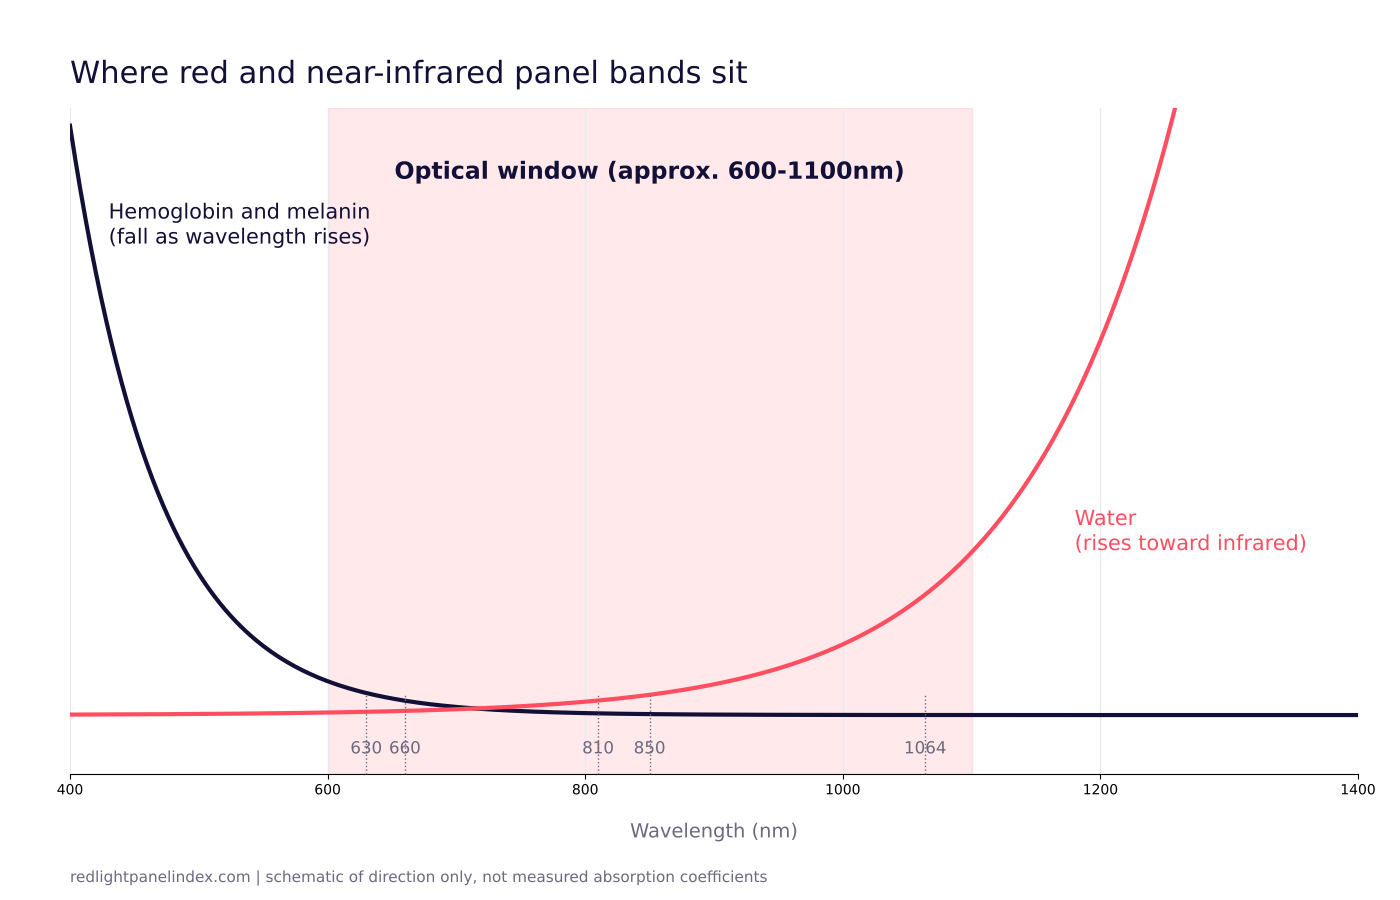
The Optical Window: Why Red Light Therapy Works at 600-1100nm
The optical window is the stretch of the spectrum where blood and pigment absorb less and water has not yet taken over. Here is how panel wavelengths sit in it.
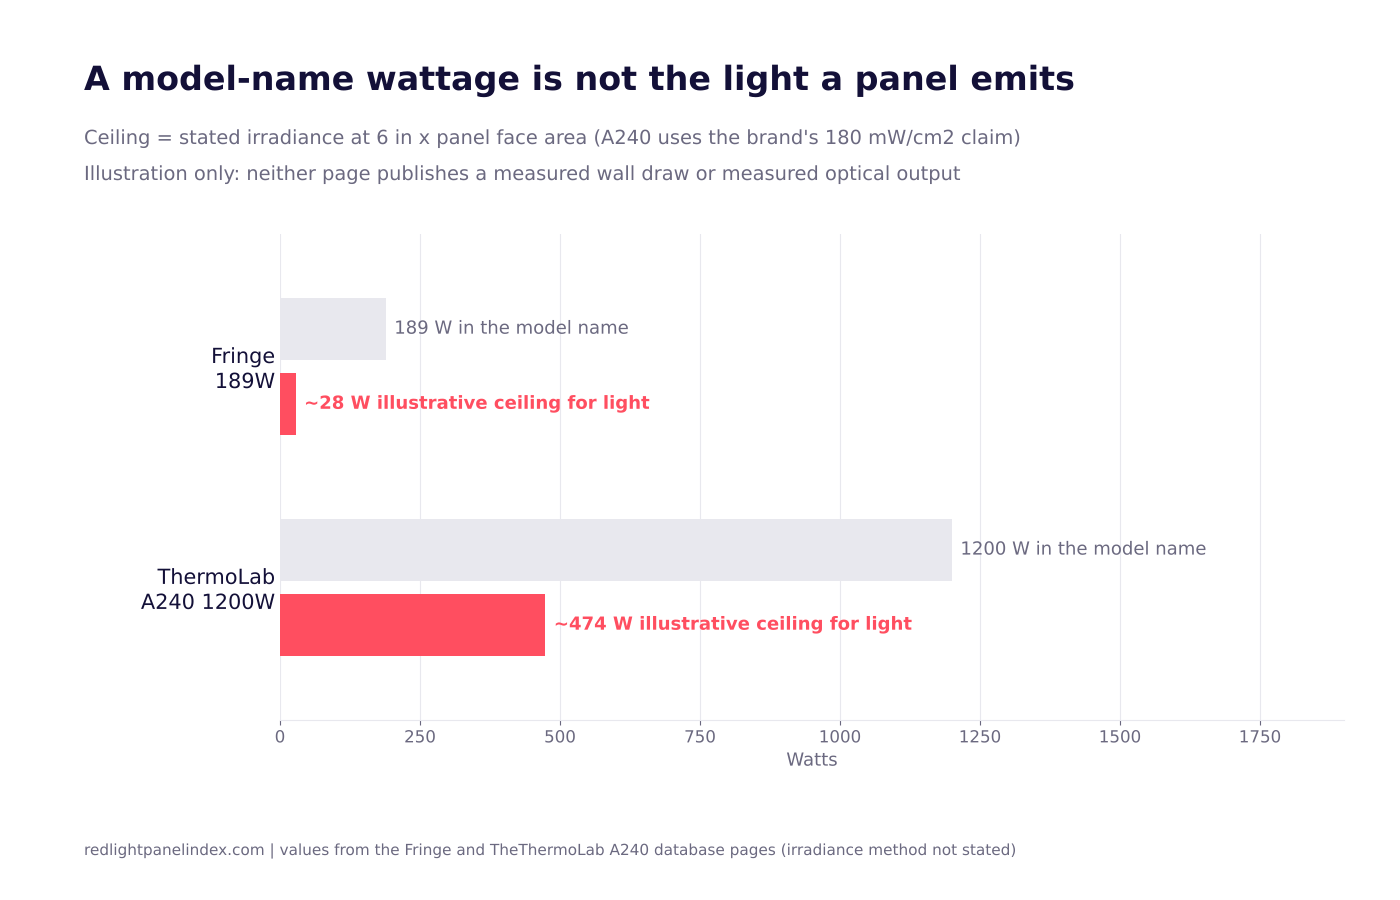
Optical vs Electrical Power: A 300W Panel Is Not 300W
Why the wattage in a panel's name is not the light it emits, how electrical input splits into light and heat, and worked examples from the database.
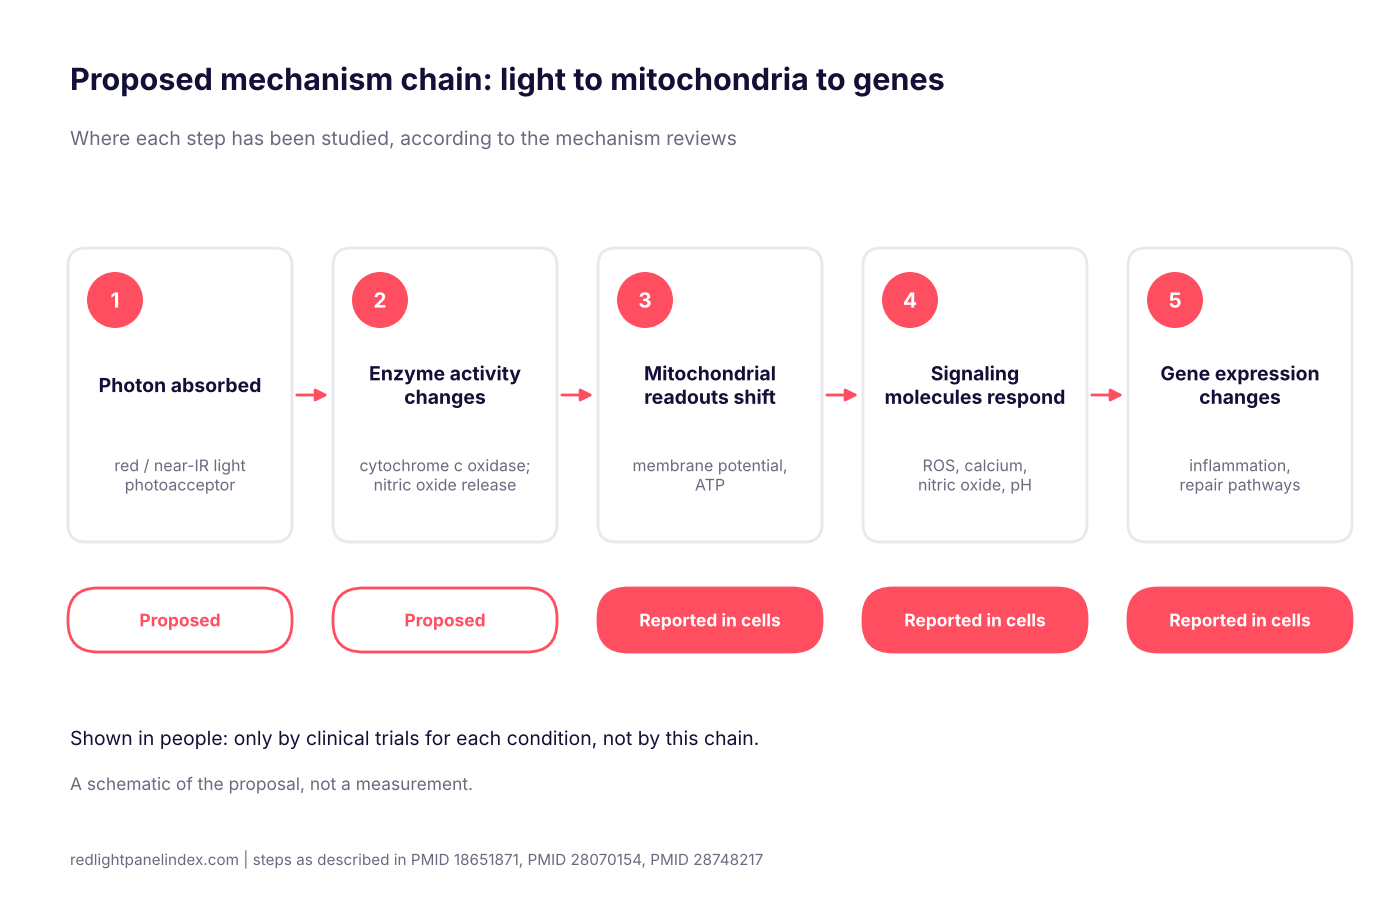
Mitochondria, ATP and Red Light: The Mechanism Explained
How red and near-infrared light is proposed to act on mitochondria and ATP, which steps are shown in cells, and which are still hypotheses for people.
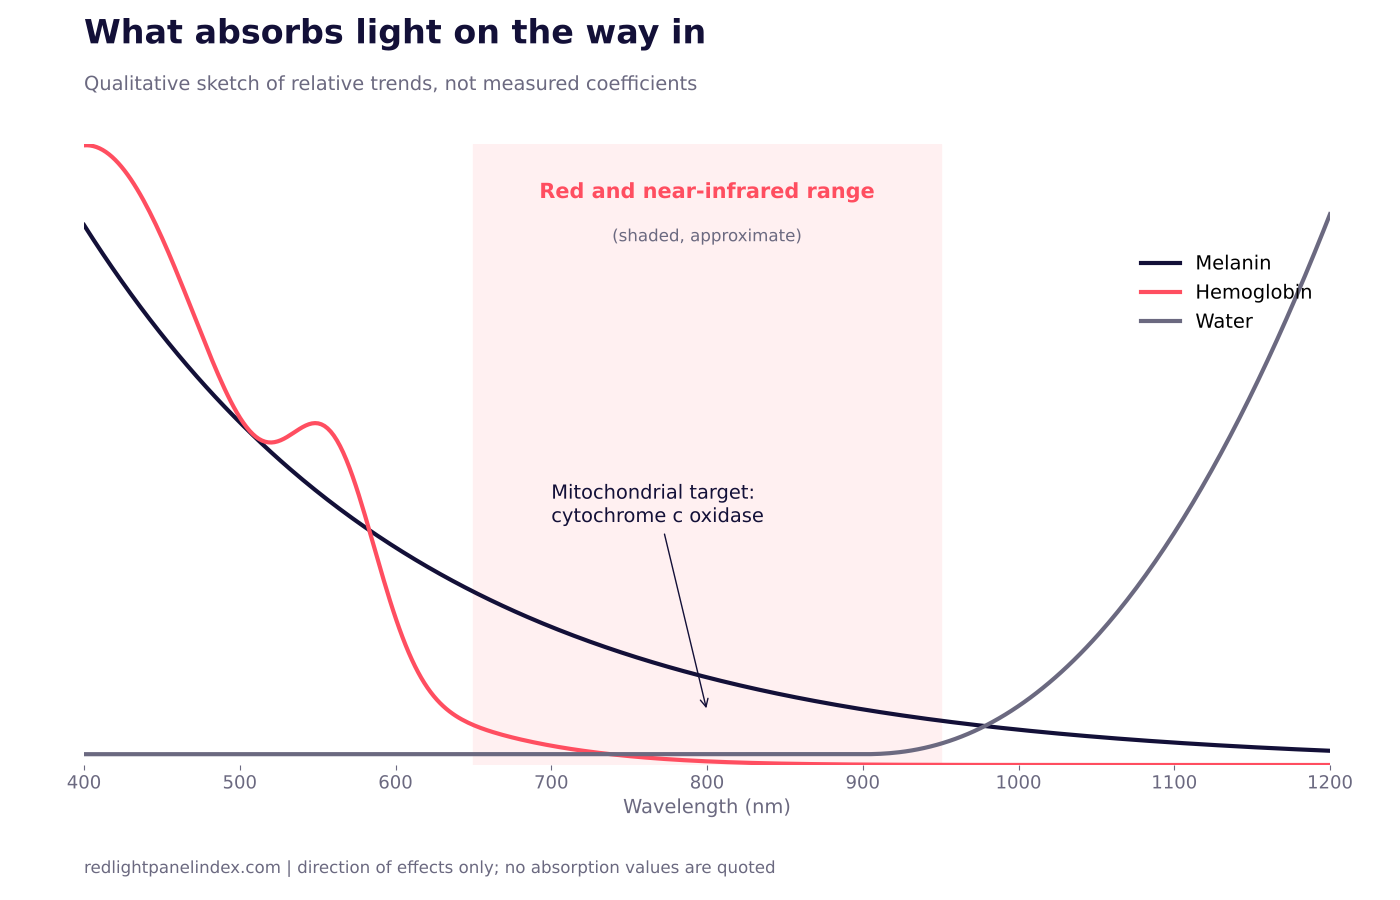
Chromophores: What Absorbs Red and Near-Infrared Light
Which molecules absorb red and near-infrared light in the body, how that shapes penetration, and why skin tone and hydration change the dose a panel delivers.
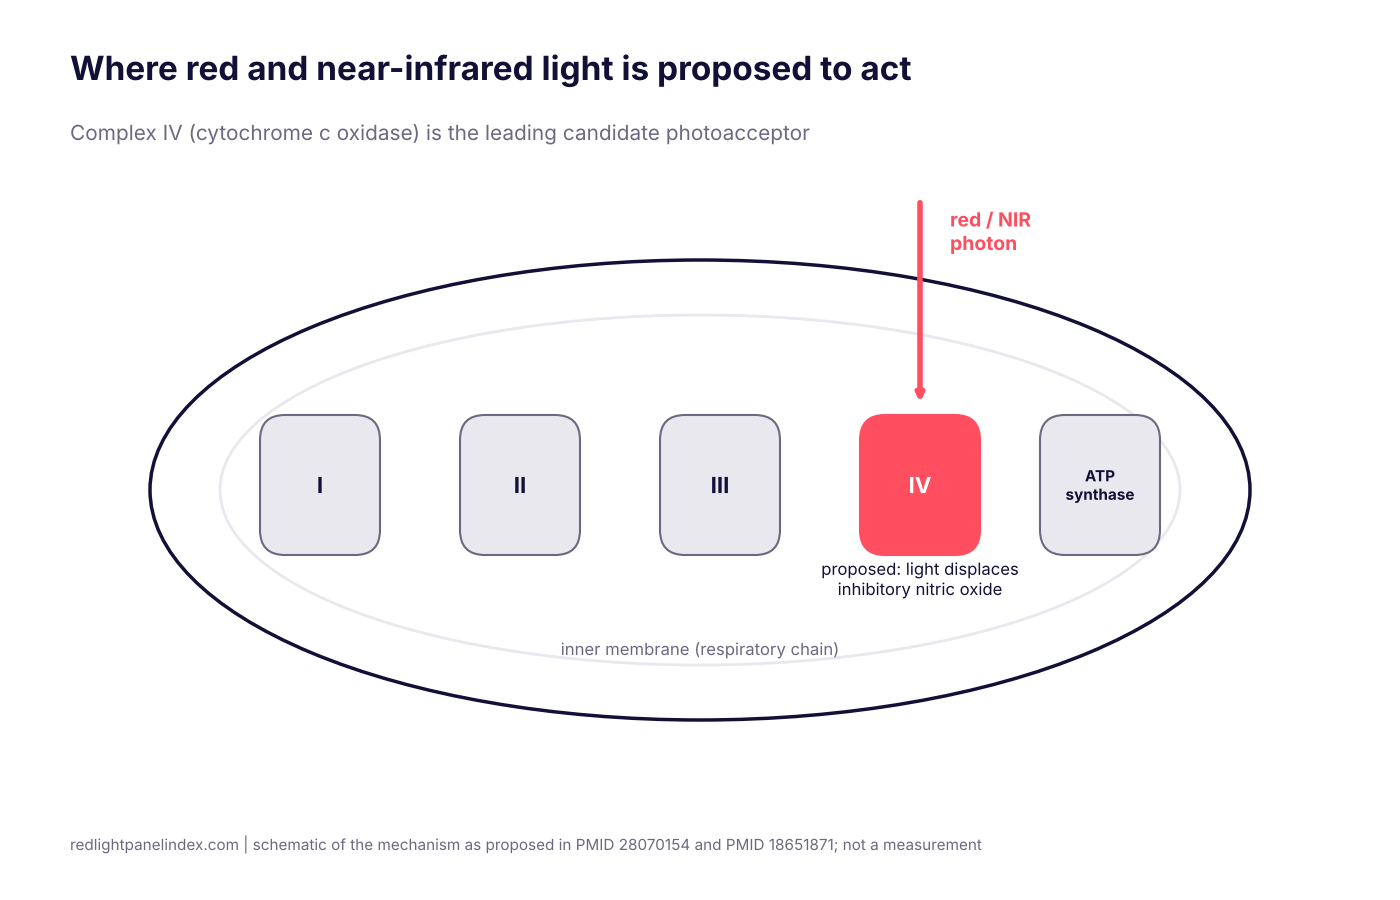
Cytochrome c Oxidase: Red Light Therapy's Main Target
What cytochrome c oxidase is, why it is the leading proposed photoacceptor for red and near-infrared light, the neuron study behind it, and the caveats.
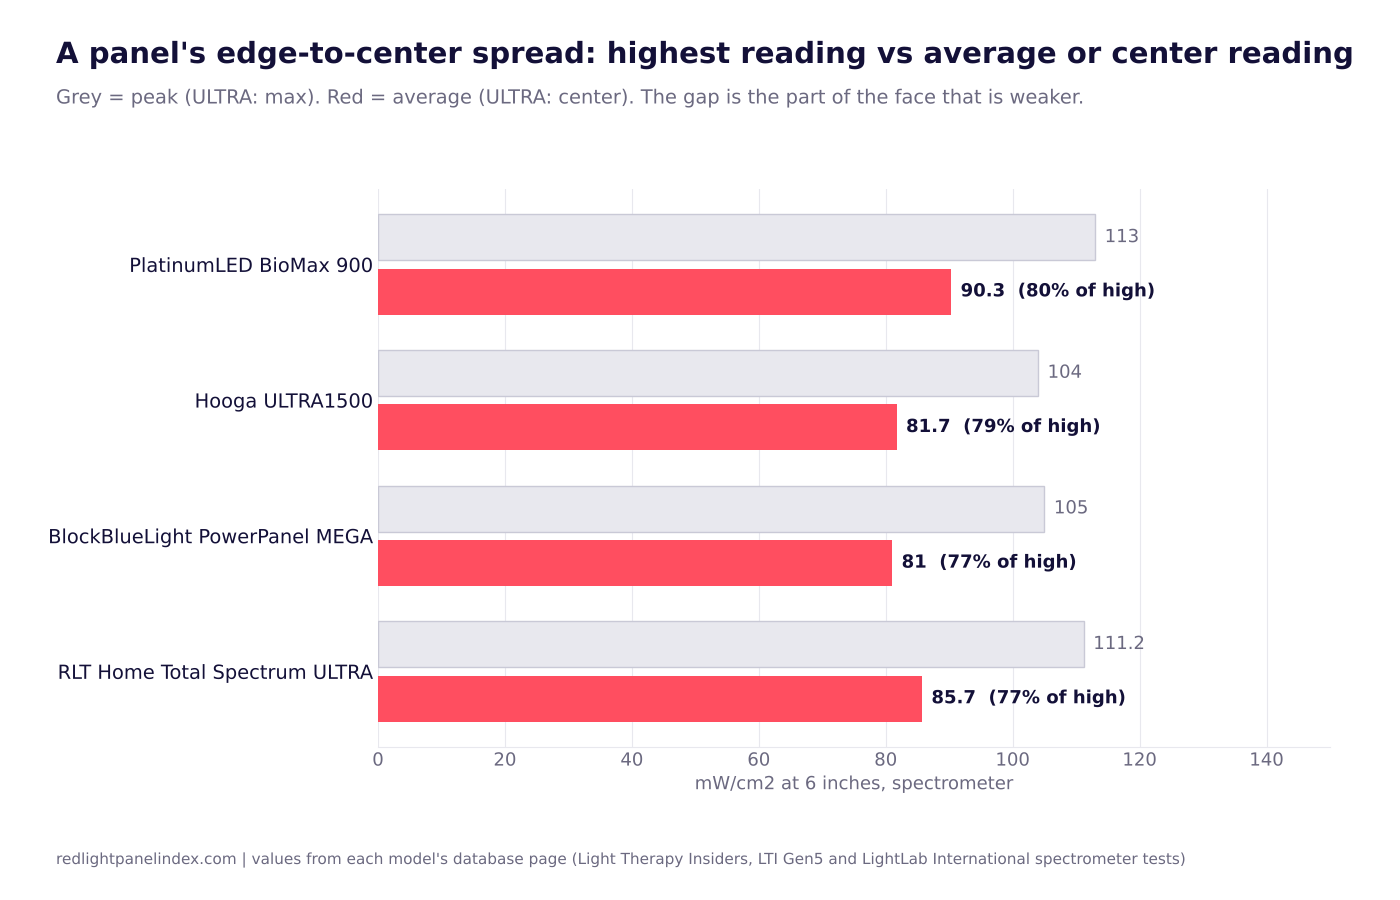
Treatment Area and Coverage: What a Panel Actually Treats
Effective treatment area is the part of a panel's light field that reaches useful irradiance at your distance. How to estimate it and count session positions.
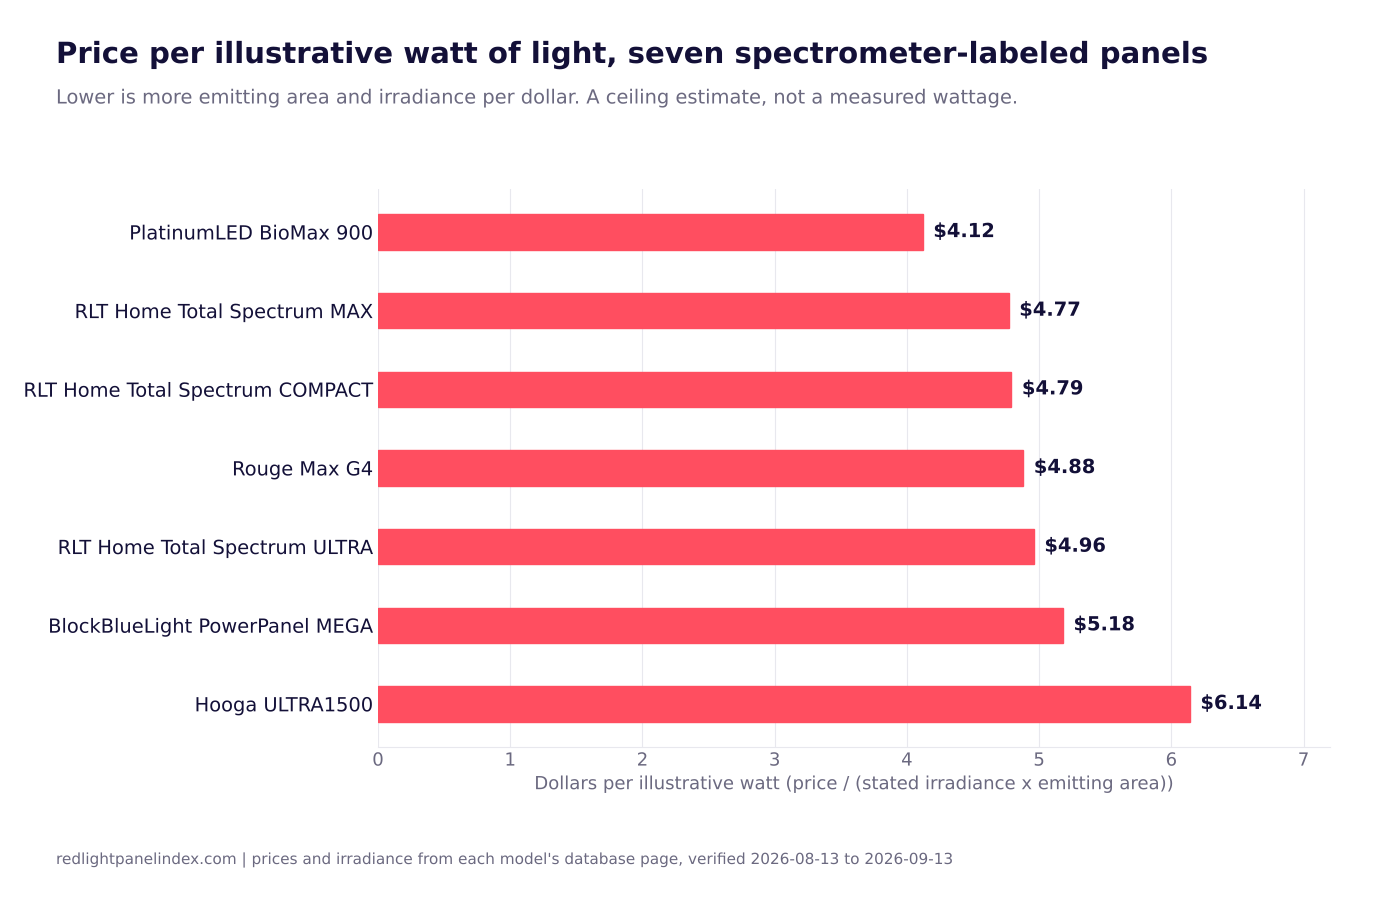
Price per Milliwatt: A Red Light Panel Value Index
Price divided by method-labeled irradiance times emitting area for seven spectrometer-tested panels, with the method, the ranking and its limits.
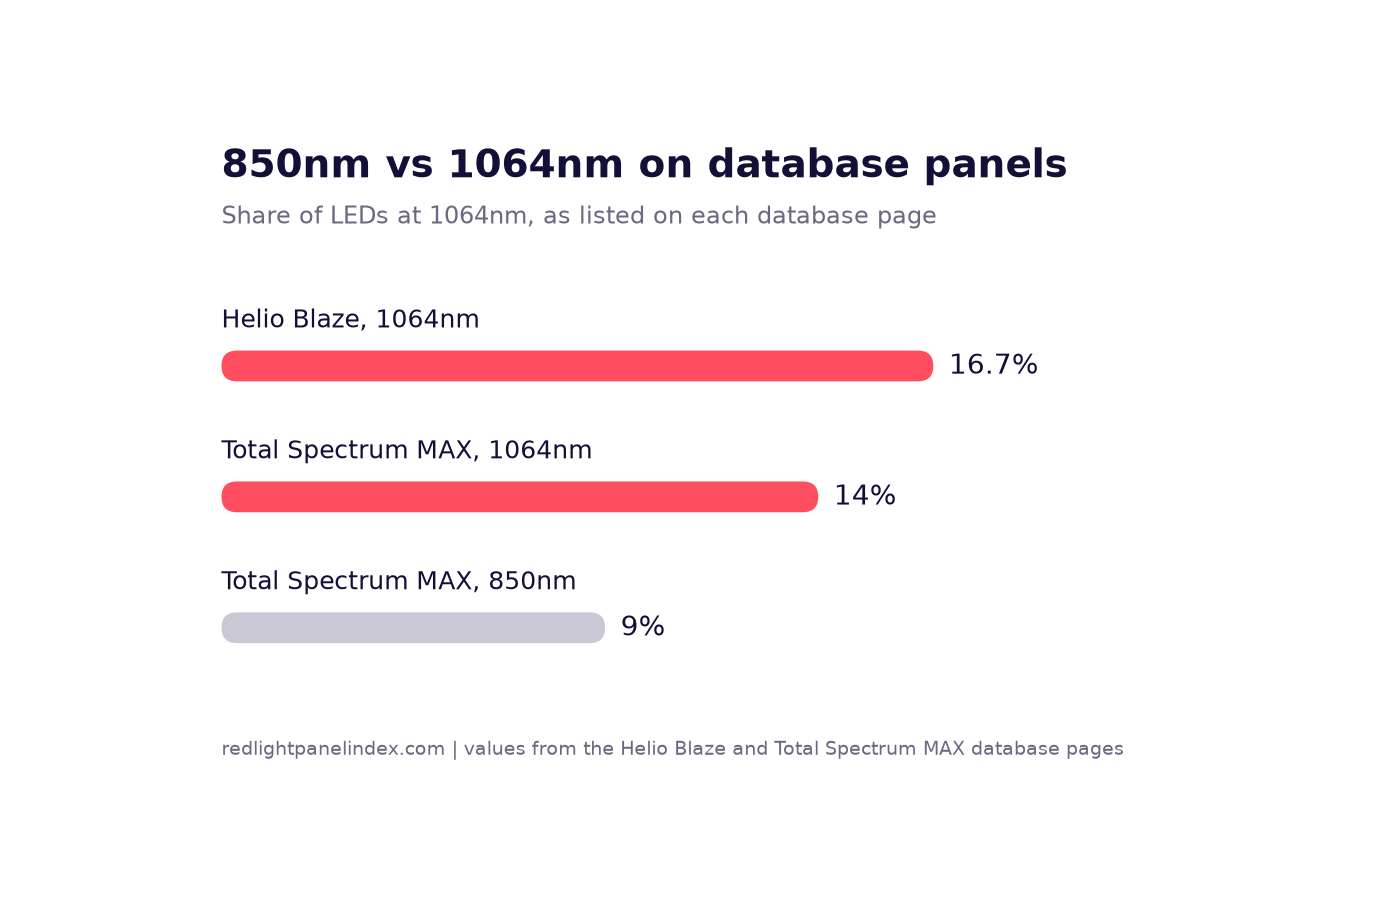
850nm vs 1064nm: Is Deeper Infrared Worth It?
850nm is the standard near-infrared band; 1064nm is rare on home panels. What the research covers, how little output it gets, and who should care.
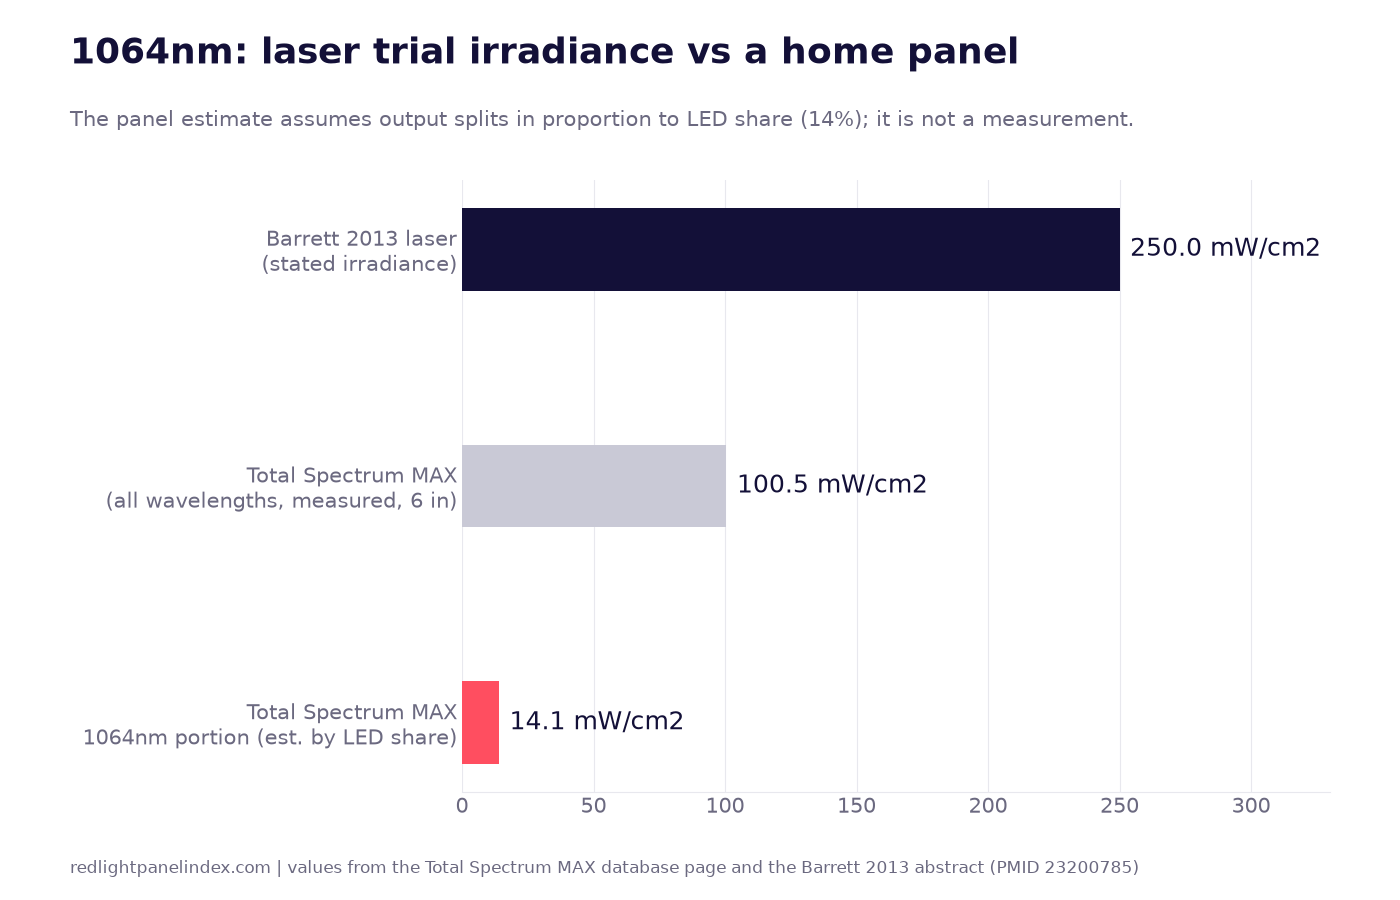
1064nm Deep Infrared in Home Panels
What 1064nm light is, what the laser research on it covers, and how few home panels carry it at a meaningful share, with worked dose arithmetic.
830nm Near-Infrared: Skin Depth Plus
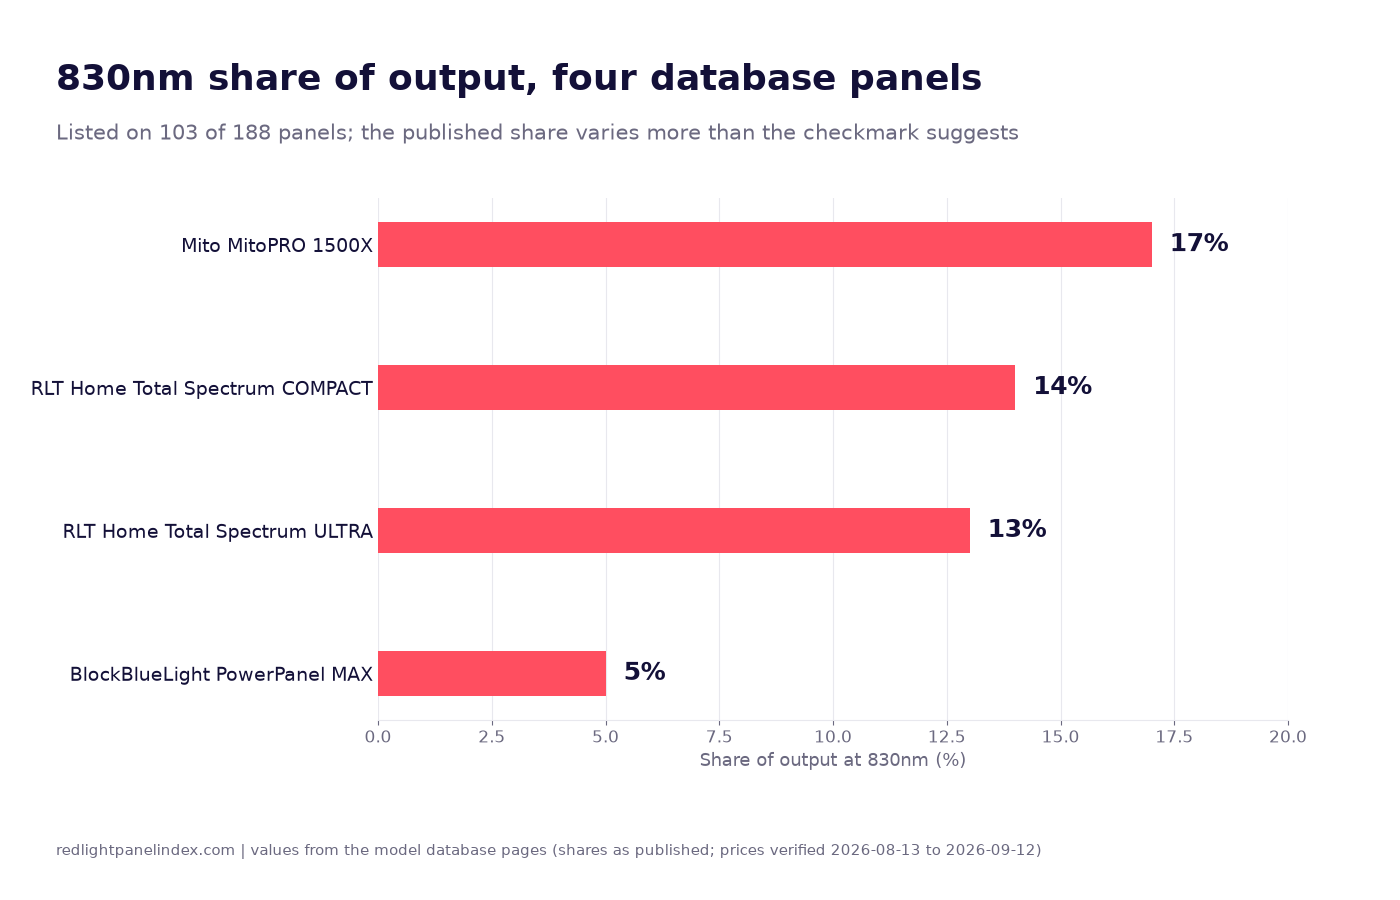
What 830nm is, the skin and psoriasis trials that paired it with red, and how much of it four database panels actually publish.
810nm vs 850nm: The Two Near-Infrared Standards
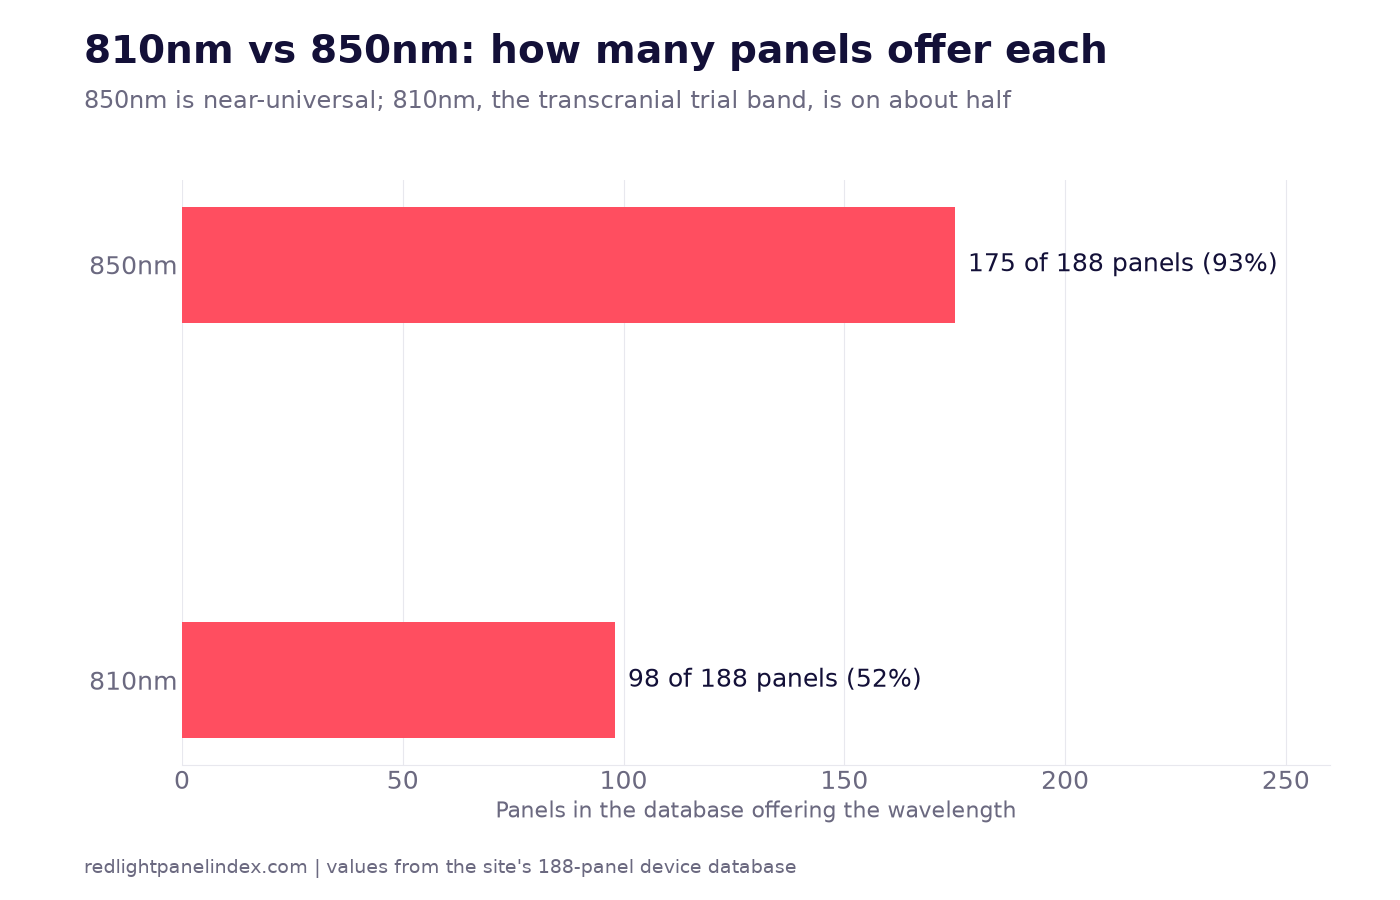
810nm has the longer trial history and 850nm ships on nearly every panel. What separates them in practice, and what the database shows.
810nm Near-Infrared: The Brain and Deep-Tissue Band
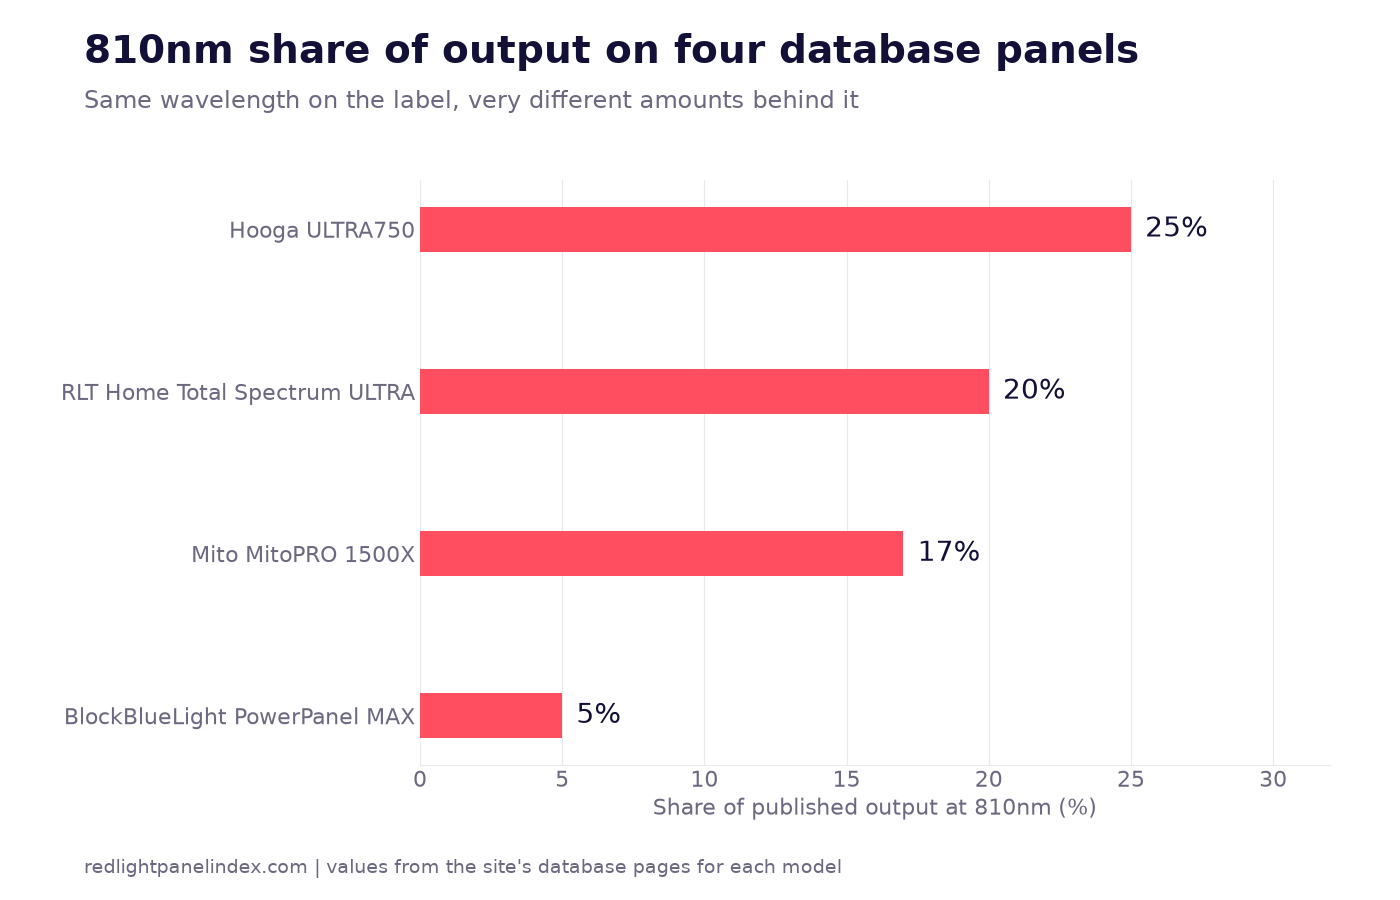
What 810nm is, why transcranial research used it, how much of a panel's output it gets, and which database panels include it.
What a Spectrometer Measures in Red Light Panel Testing
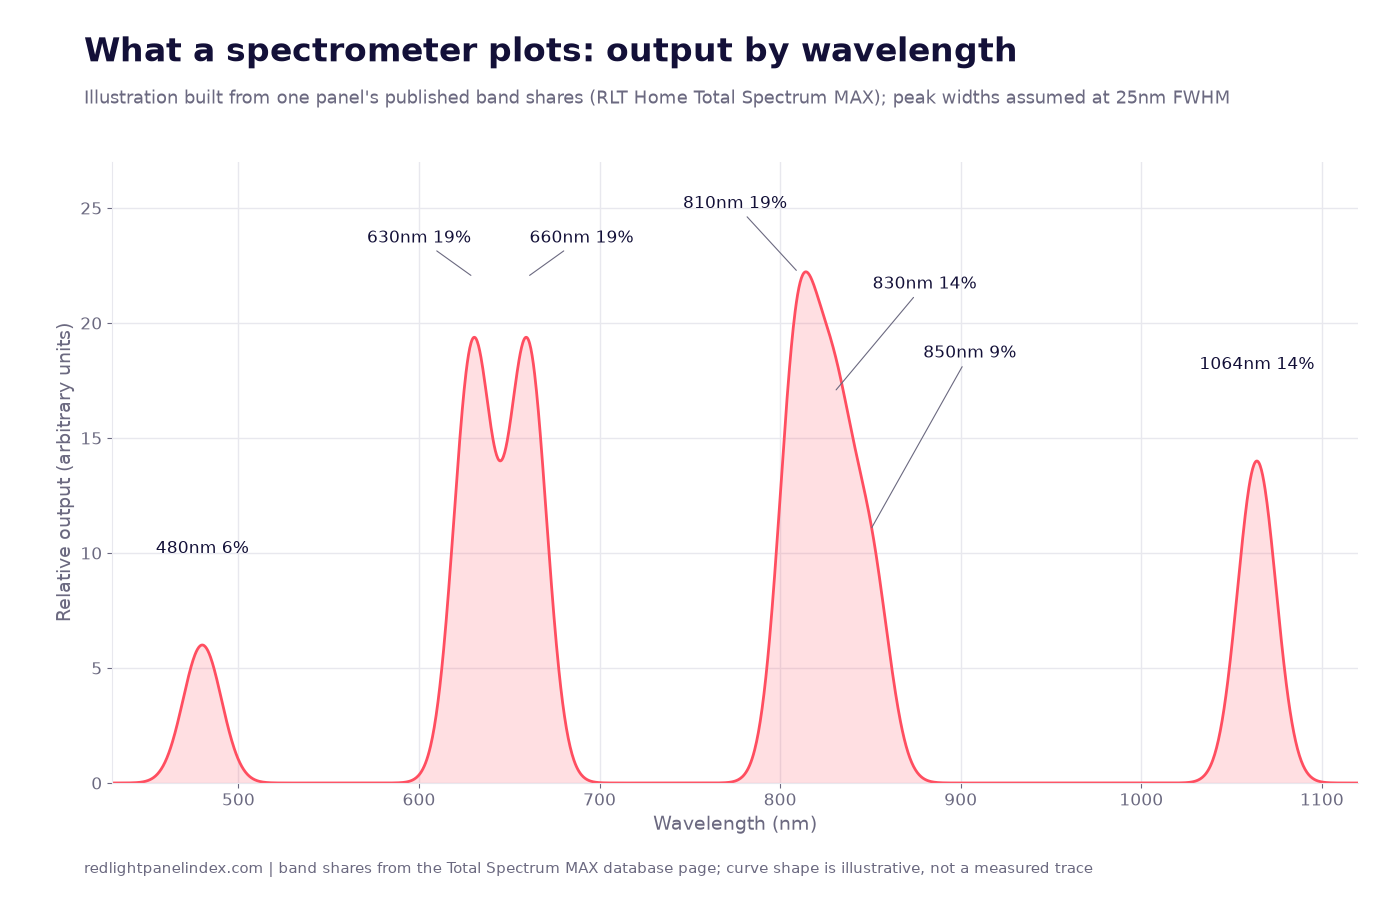
A spectrometer splits a panel's light by wavelength and measures each band, which is why it is the reference method for irradiance and band shares.
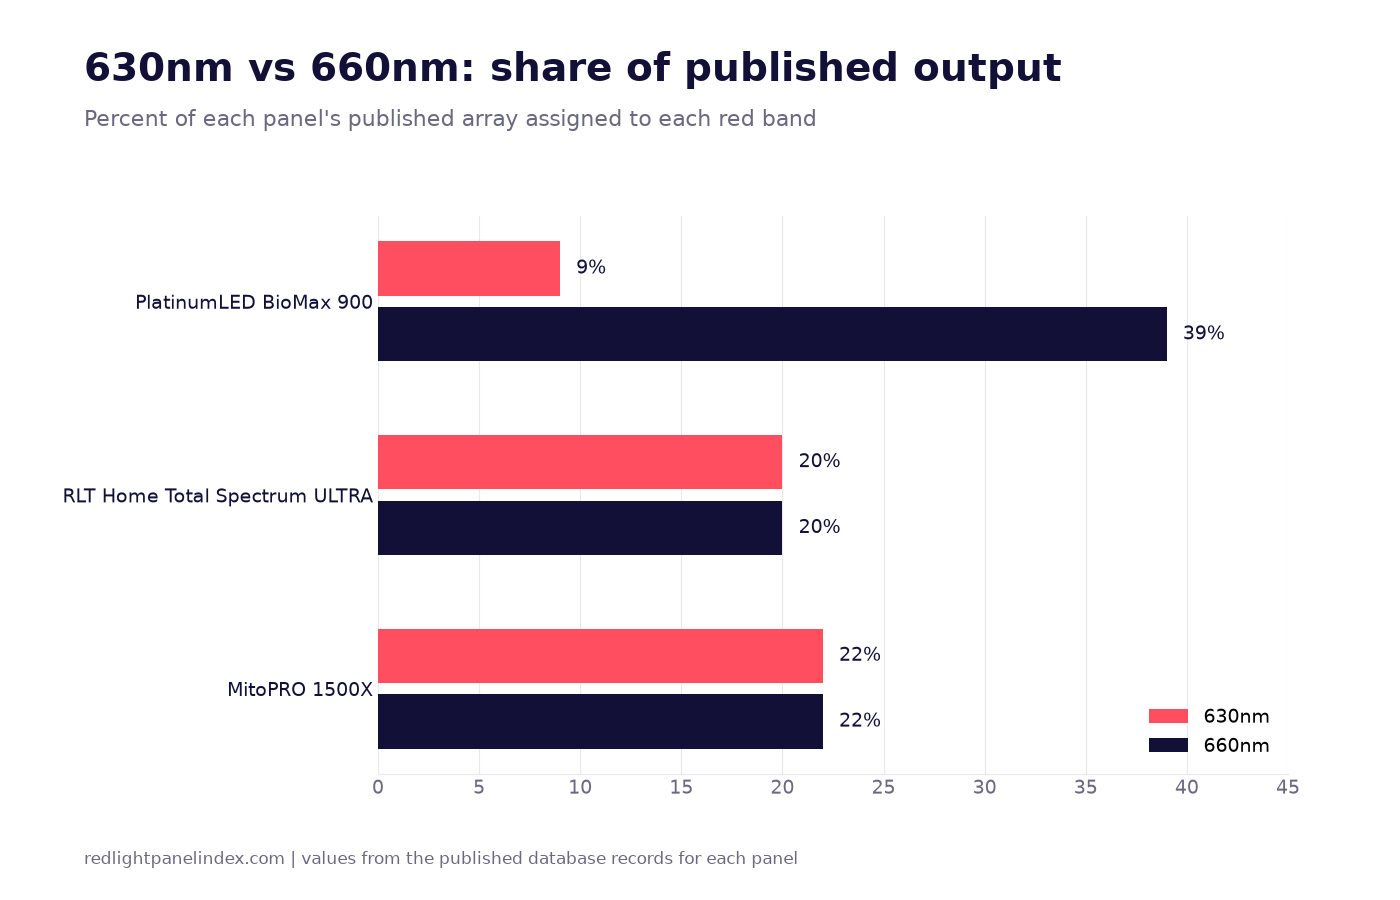
630nm vs 660nm Red Light: Does 30 Nanometers Matter?
How the two red bands compare on depth, trial history and panel share, and why dose and distance usually outweigh the 30nm gap.
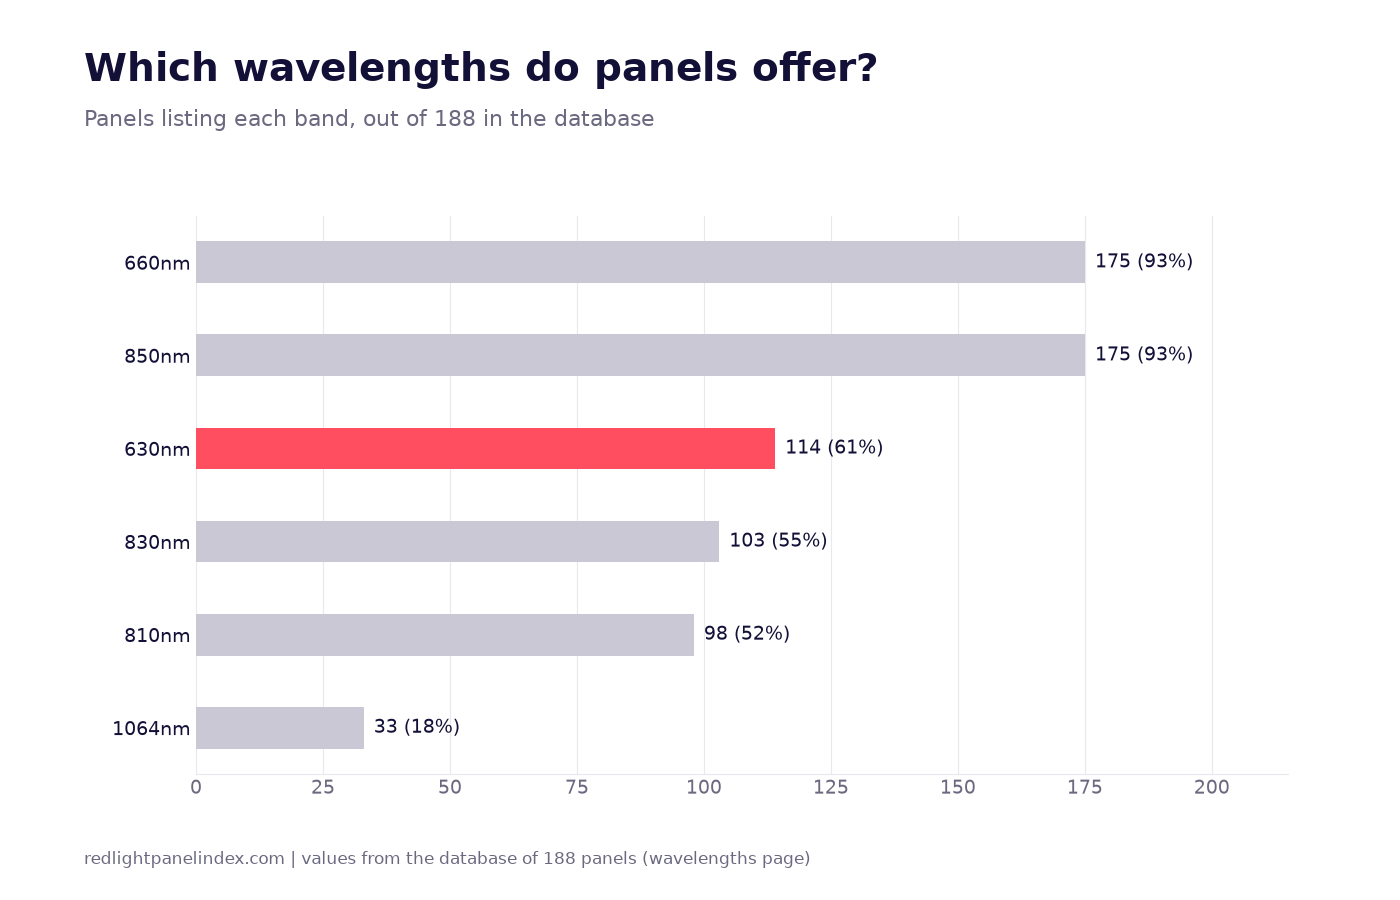
630nm Red Light: What It Does and Which Panels Use It
What 630nm red light is, the skin trials that used 630 to 633nm, and which panels carry it, with database shares and caveats.
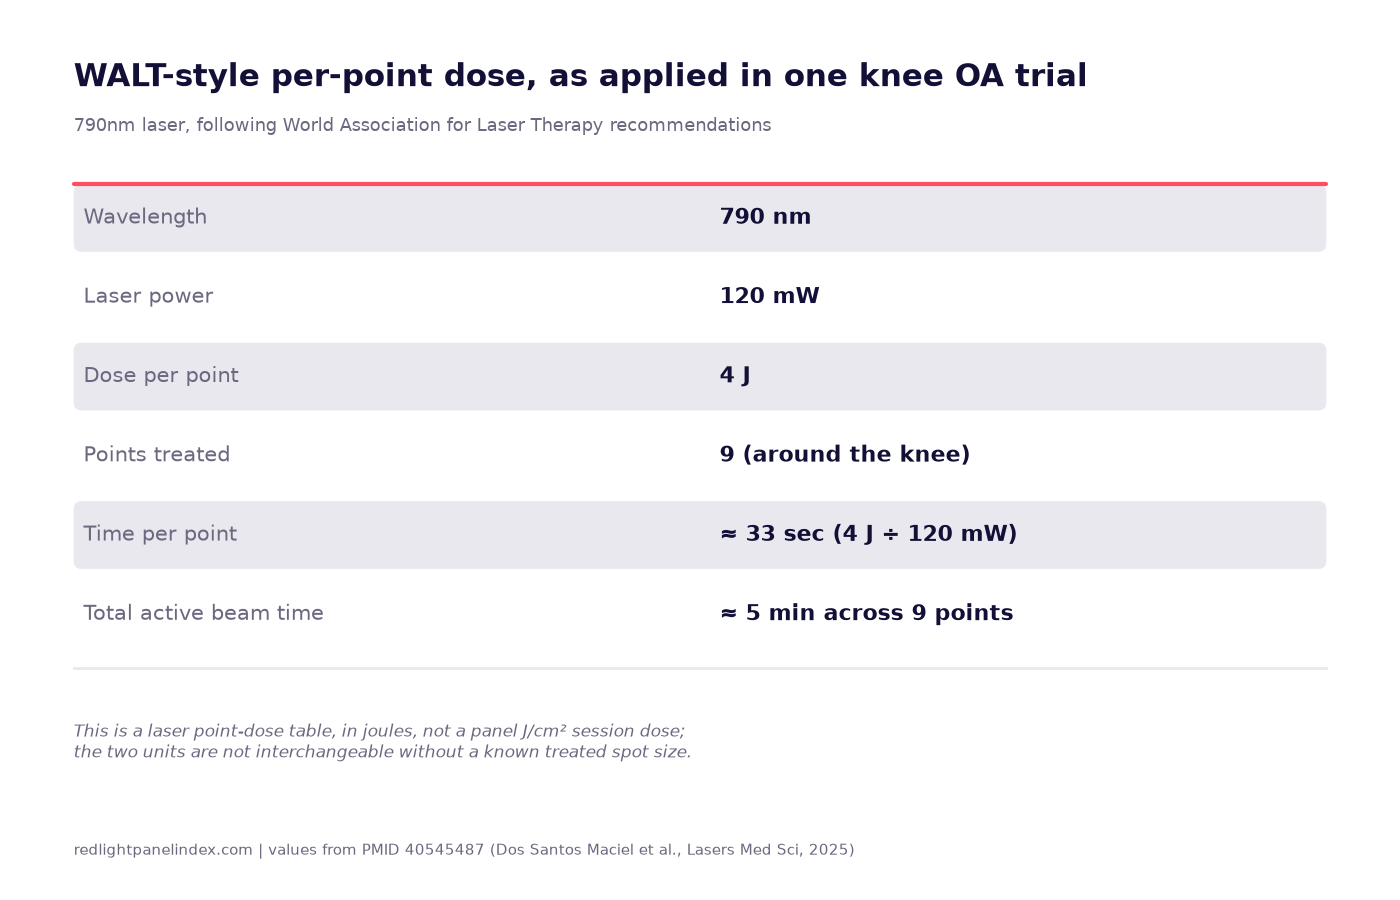
WALT Dosing Recommendations Explained
What WALT's per-point joule dose tables are, how one knee trial applied them, and why the number cannot go straight into a panel session timer.
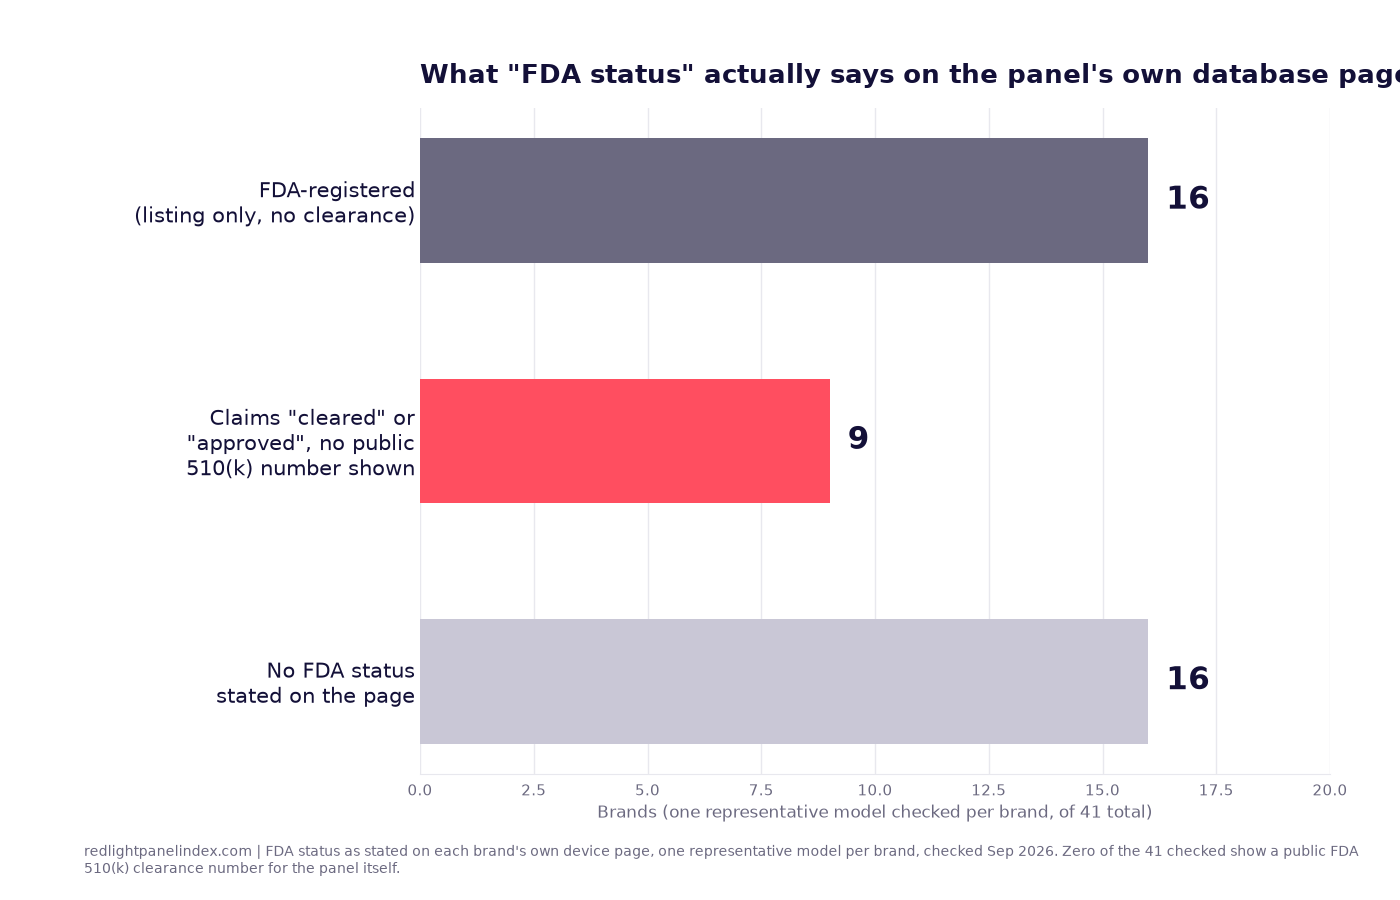
'Medical Grade' Red Light Panels: An Audit of the Claim
Medical grade
What a Solar Power Meter Measures (And Why Brands Use One)
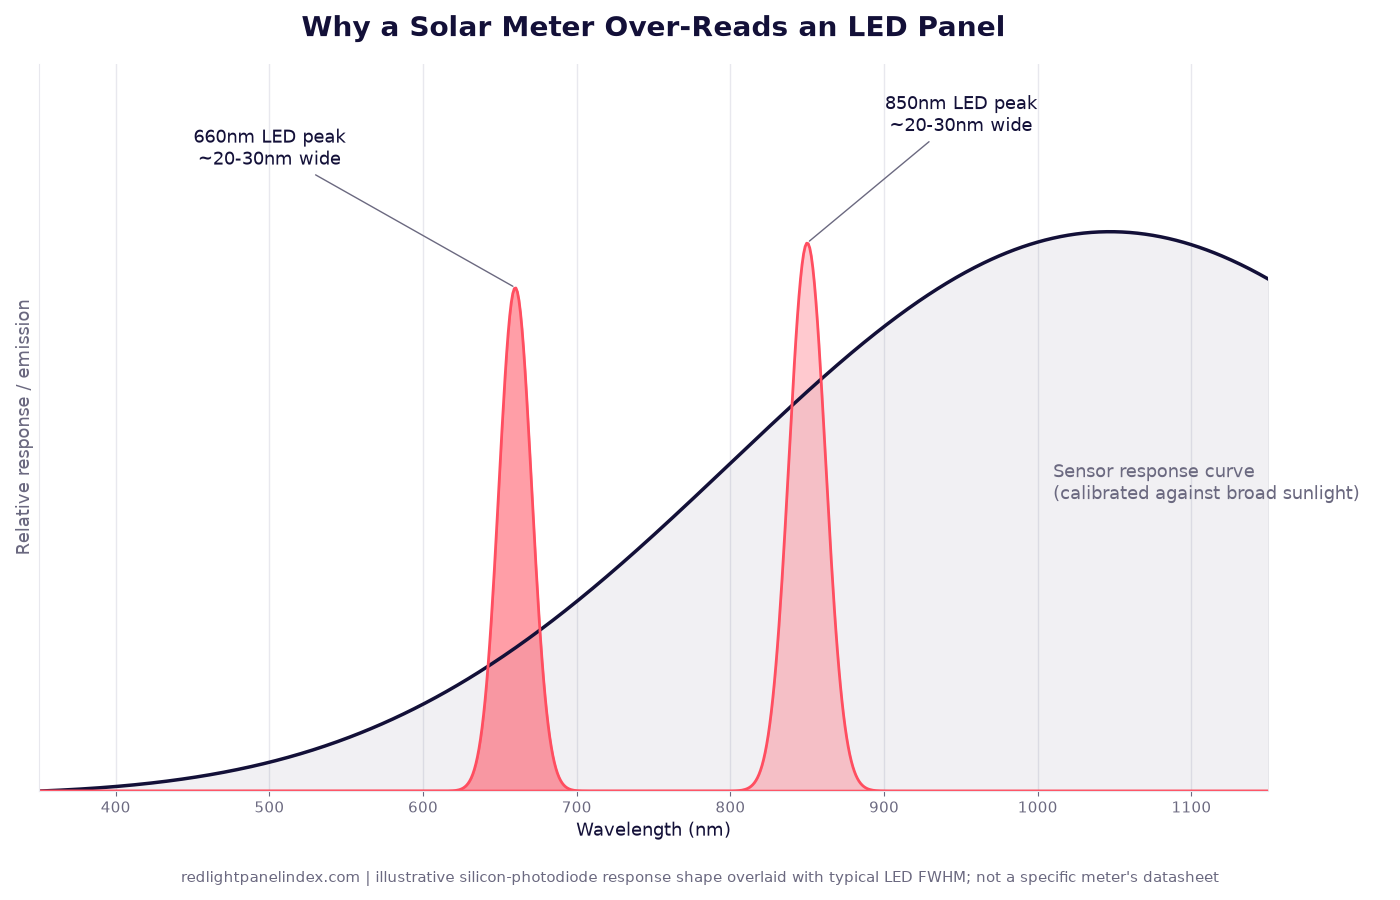
A solar power meter is a broadband silicon-photodiode sensor built for sunlight, not narrow LED peaks, and that mismatch is why its readings run high.
EMF in Red Light Panels: Claims vs Measurements
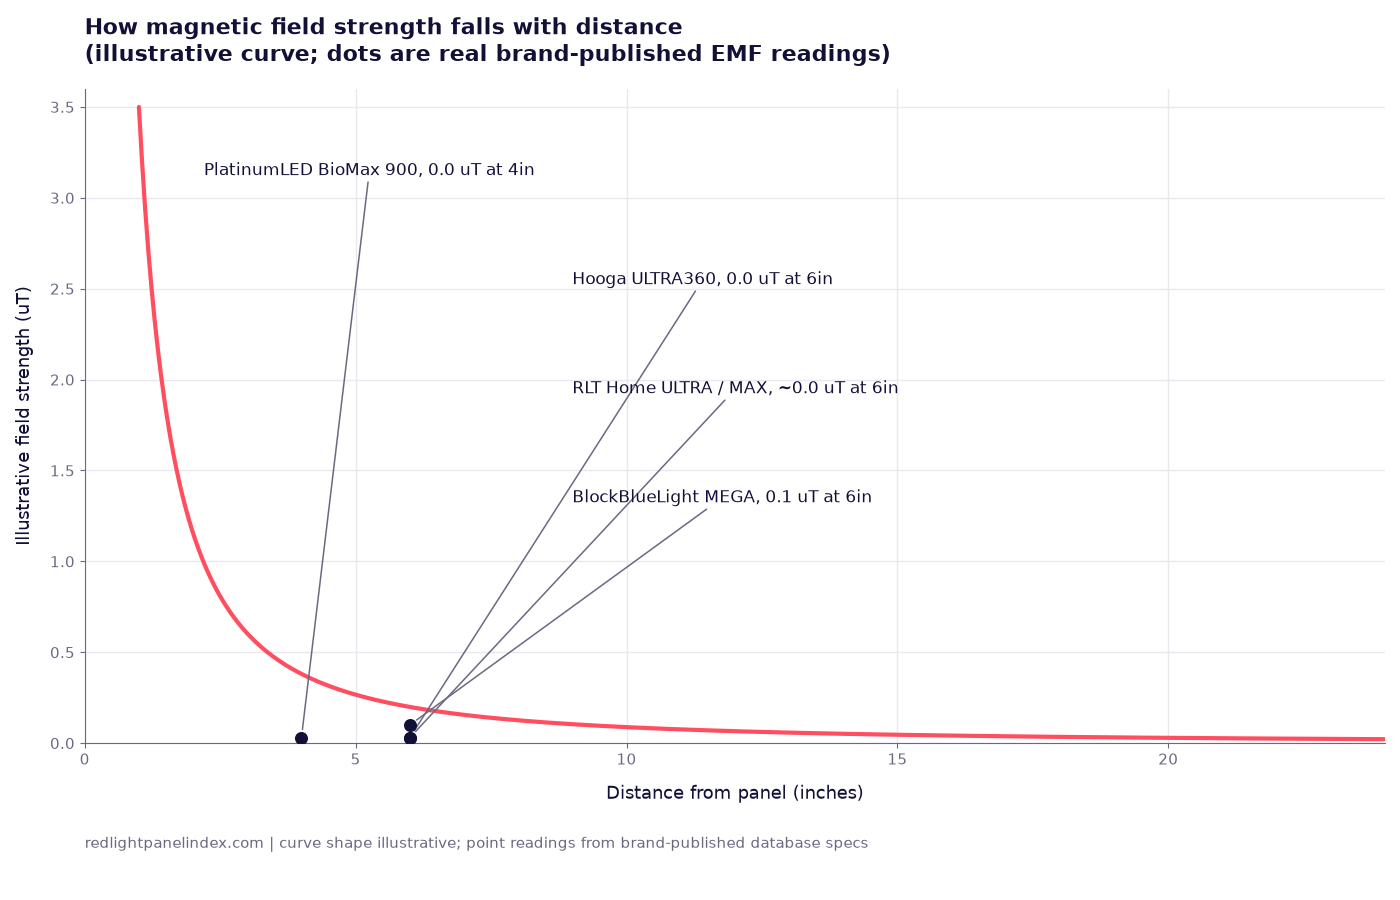
What kind of EMF a panel produces, how it falls with distance, how brands measure it, and what this site's database shows brand by brand.
LED vs Laser for Red Light Therapy: Does Coherence Matter?
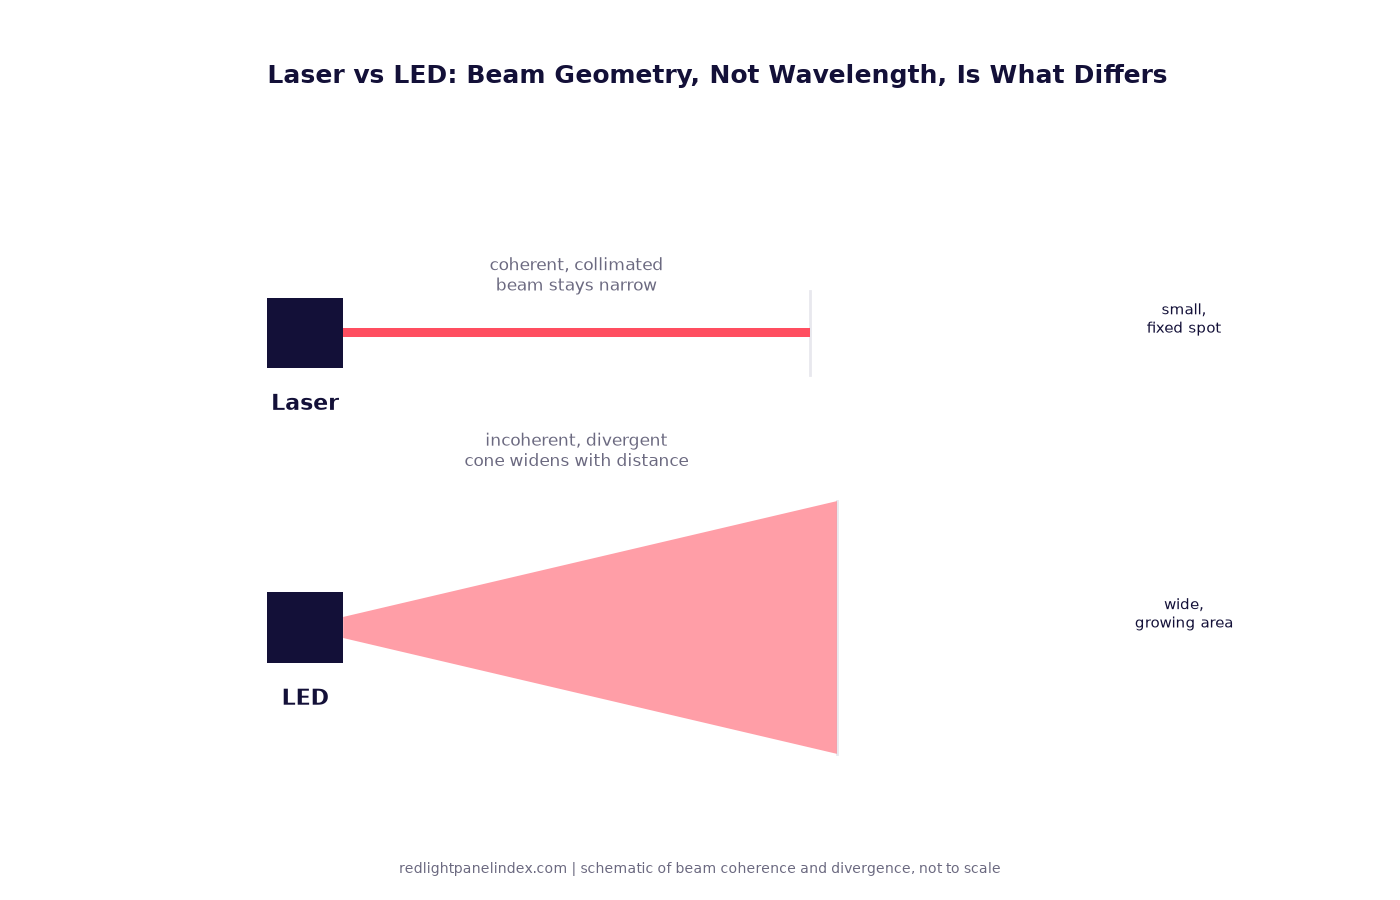
Most trial evidence started with lasers; most home devices use LEDs. What coherence is, and whether it changes tissue outcomes.
Pulsed vs Continuous Red Light: What the Evidence Says
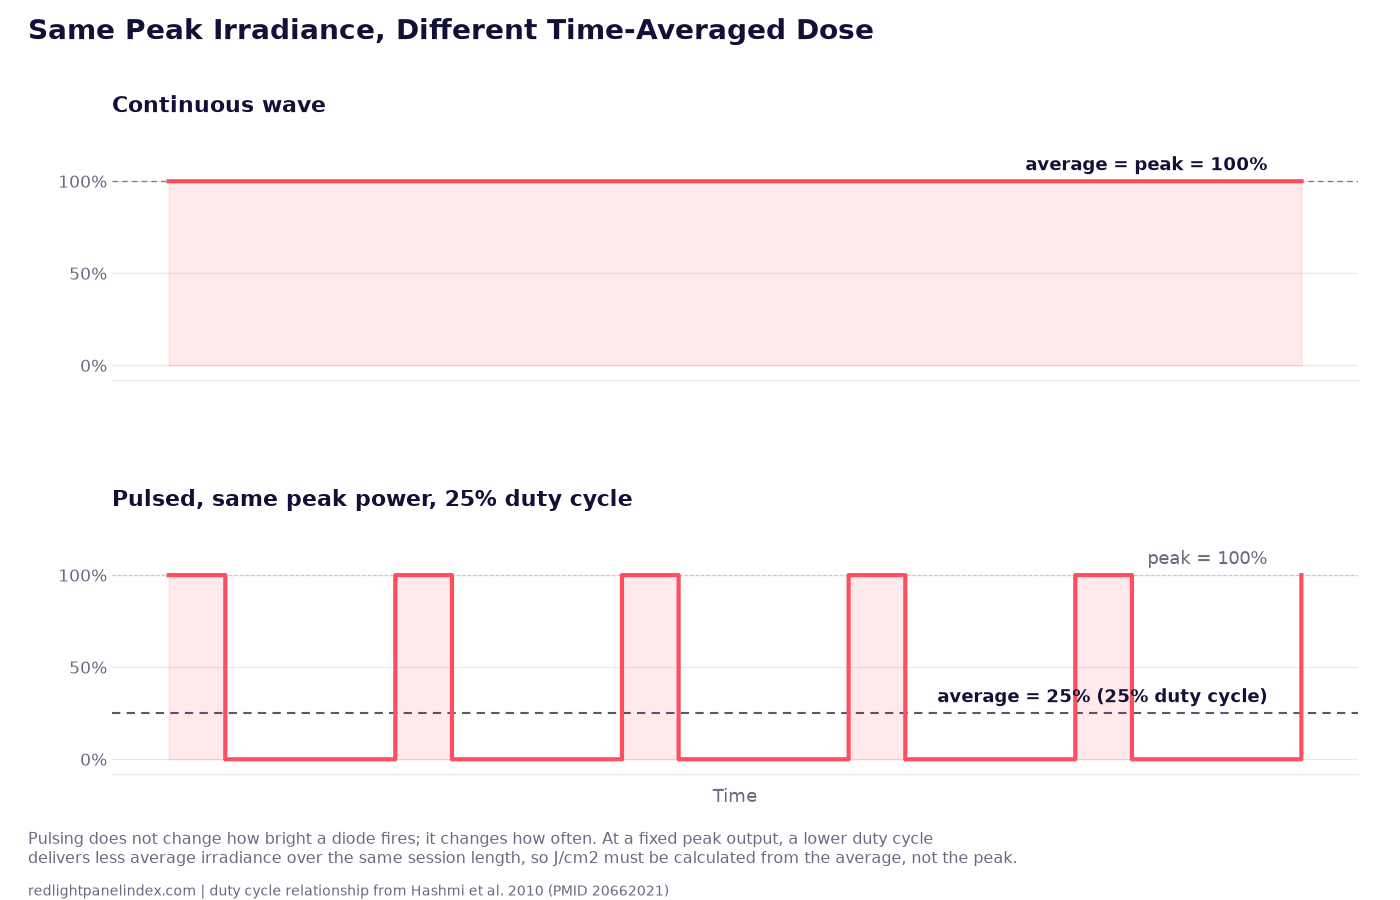
A 2010 review of pulsing in low-level light therapy found mixed, condition-specific results and no general advantage over continuous light.
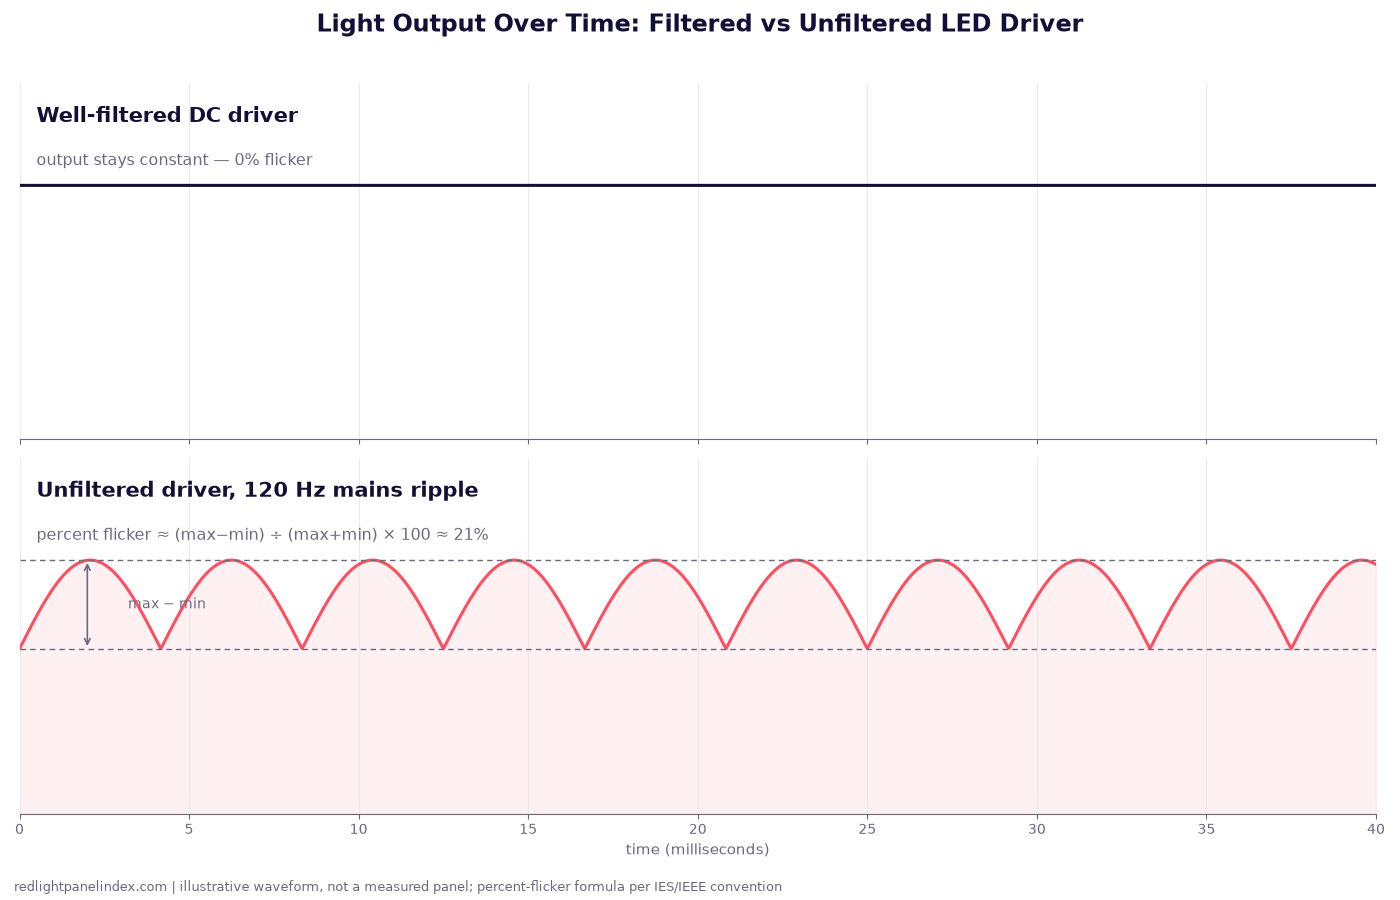
Flicker in LED Panels: What It Is and Whether It Matters
Percent flicker and flicker index explain the rapid brightness cycling a driver can leave in LED output, and why it is a comfort issue, not a therapeutic one.
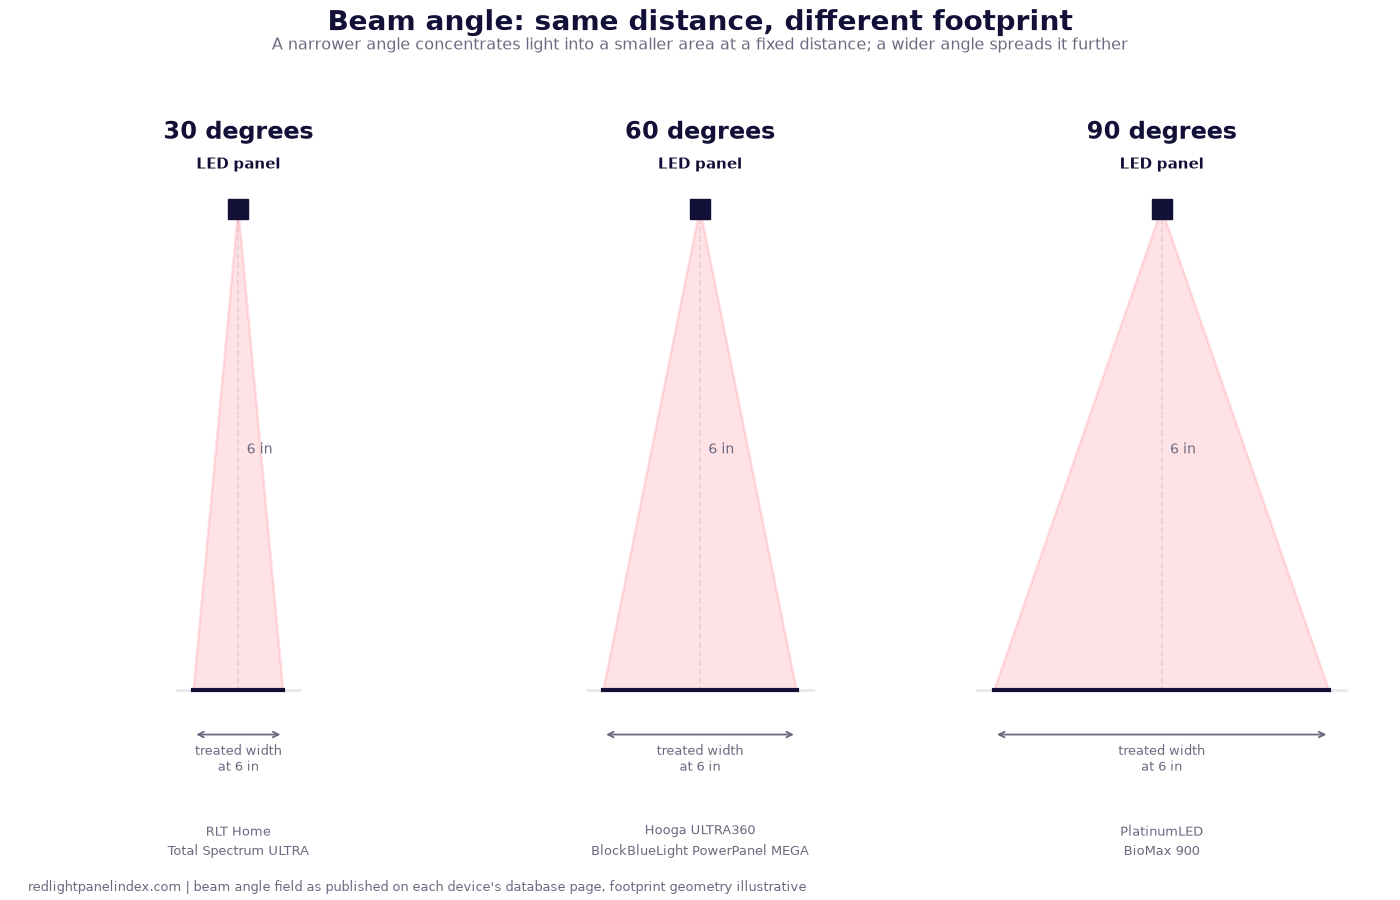
Beam Angle Explained: 30 vs 60 vs 90 Degrees
Beam angle sets how tightly an LED panel's light concentrates at a given distance, and how much area it covers. What 30, 60 and 90 degrees trade off.
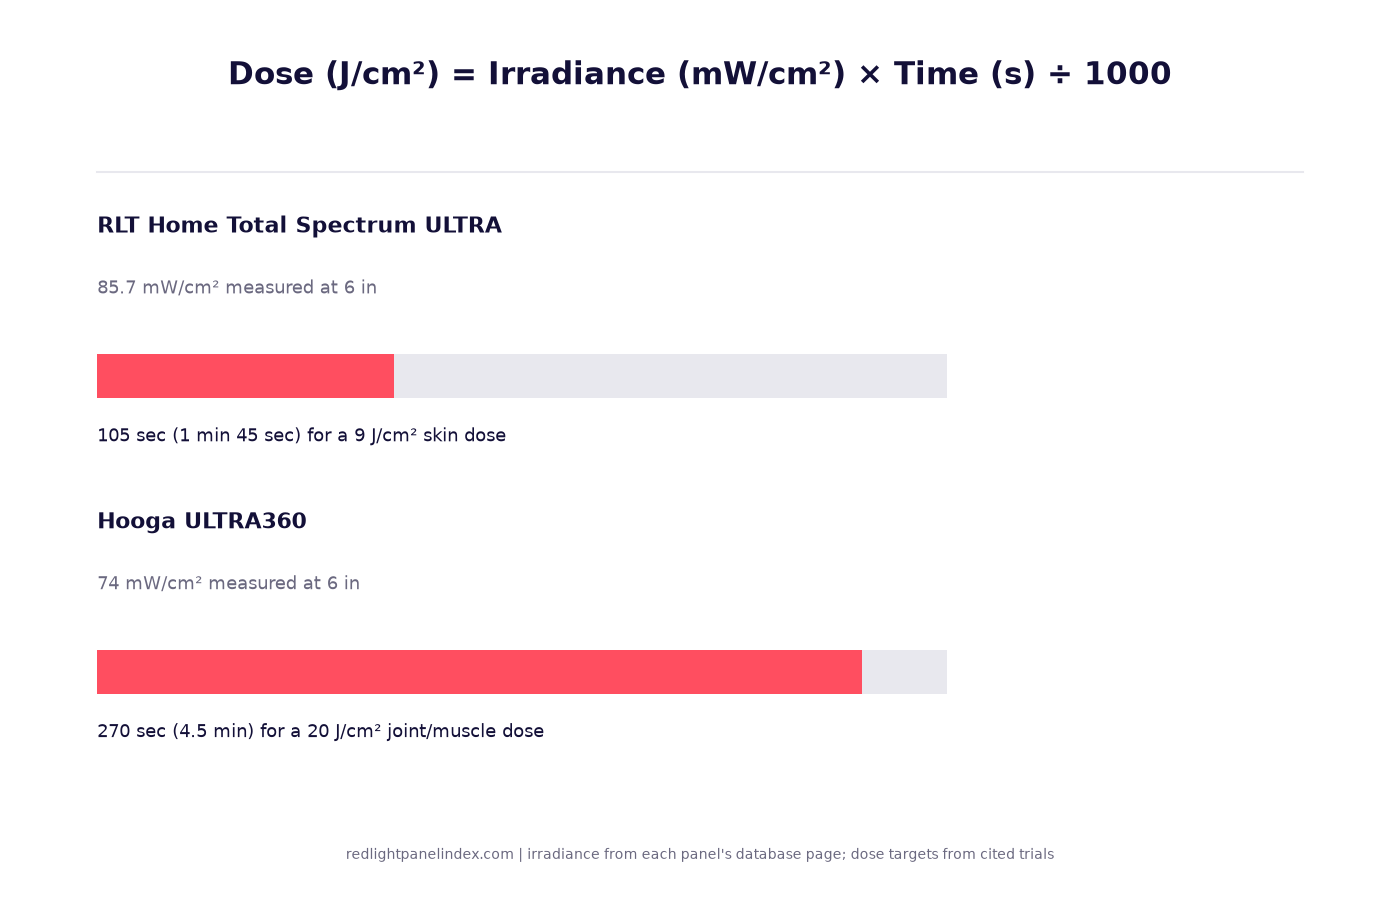
Joules per cm2 Explained: How Red Light Dose Is Measured
J/cm2 is irradiance times time divided by 1000. The formula, two worked examples, and the doses actually used in the trials this site cites.
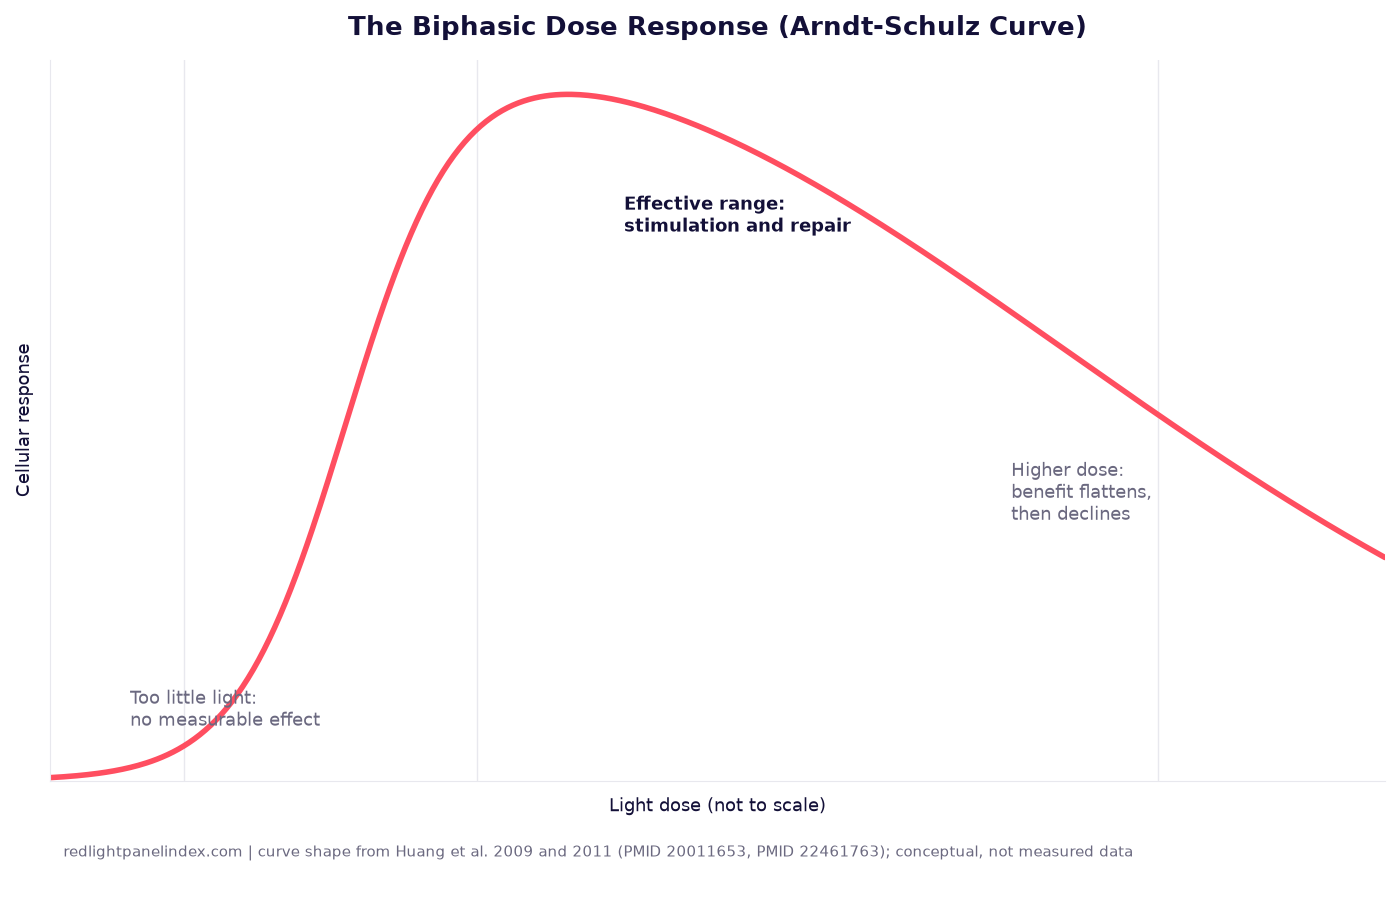
The Biphasic Dose Response: Can You Overdose on Red Light?
Two mechanistic reviews describe the Arndt-Schulz curve in light therapy - why more light does not mean a better result, and where that ceiling actually comes from.
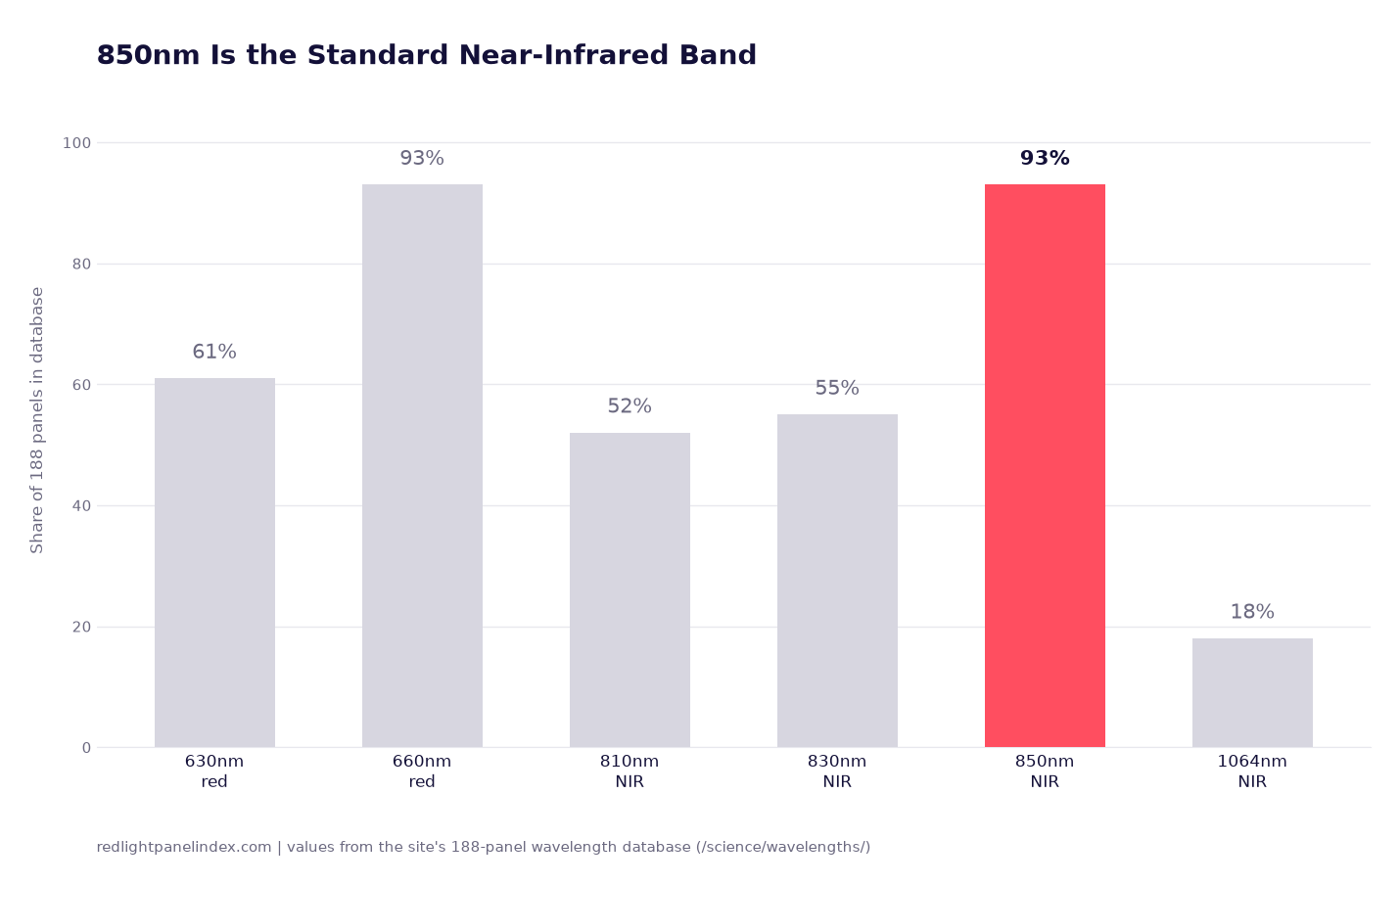
850nm Near-Infrared: The Standard NIR Band
850nm sits on 93% of red light panels, tied with 660nm. The near-infrared default, the trials behind it, and the depth it actually reaches.
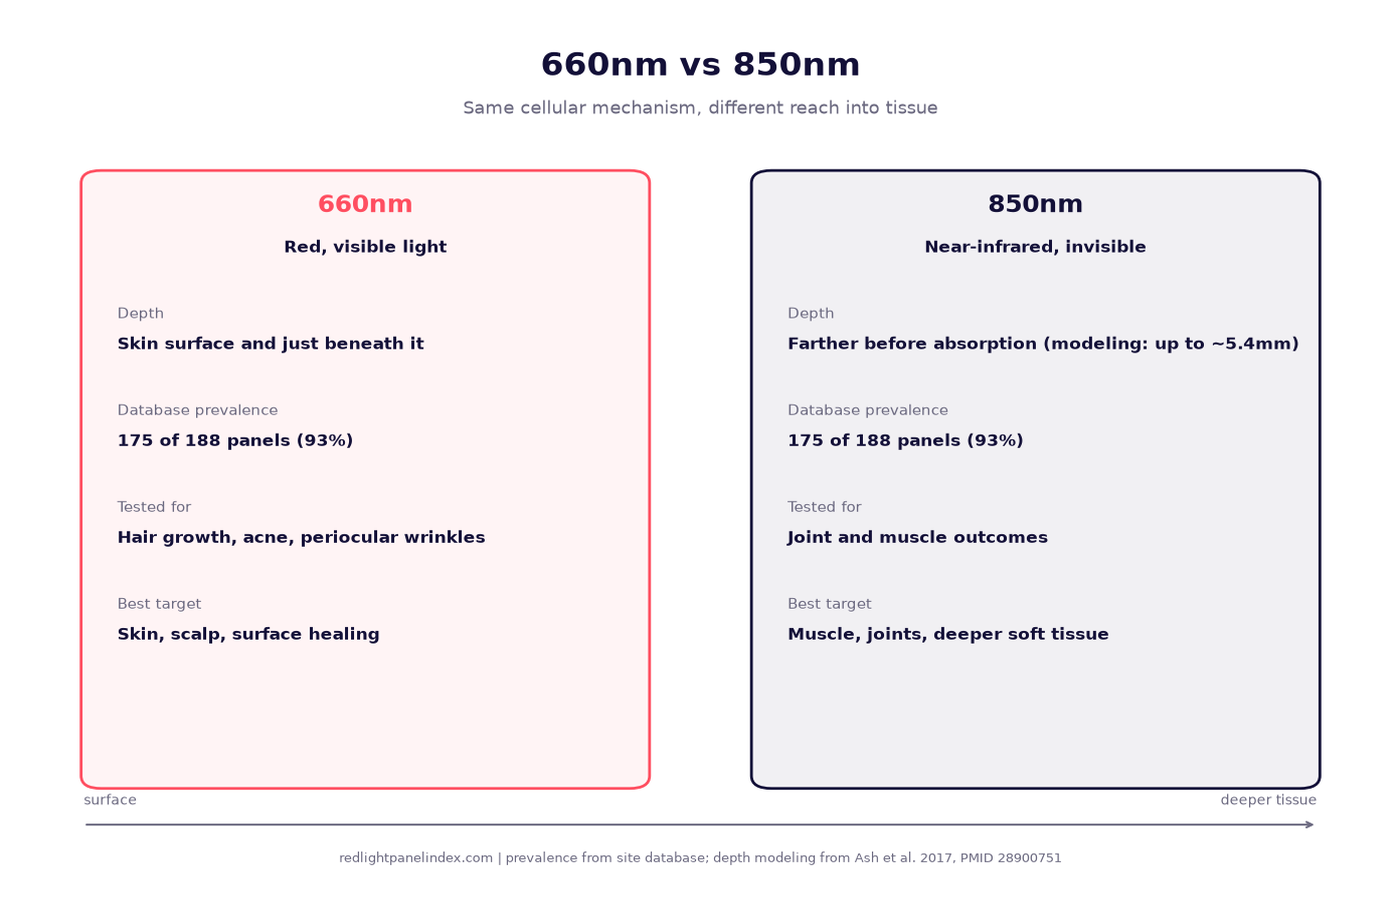
660nm vs 850nm: Which Wavelength Do You Actually Need?
The two most common panel wavelengths compared: what depth each reaches, what each was tested for, and how panels split power between them.
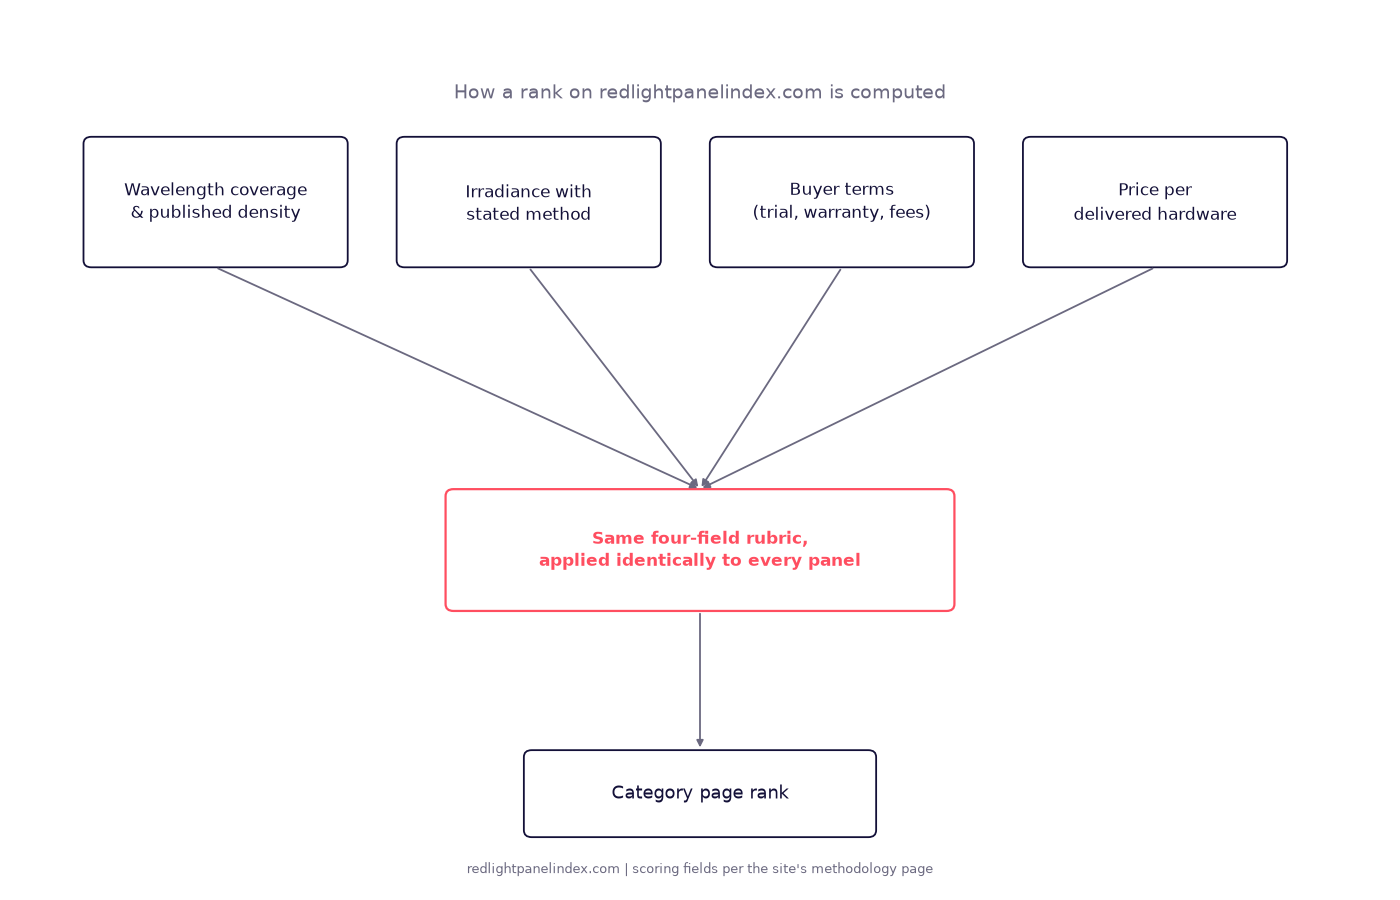
How the Rankings on This Site Are Computed
The four scoring fields behind every ranking on this site, how a method-labeled figure beats an unlabeled one, and a worked example from one list.
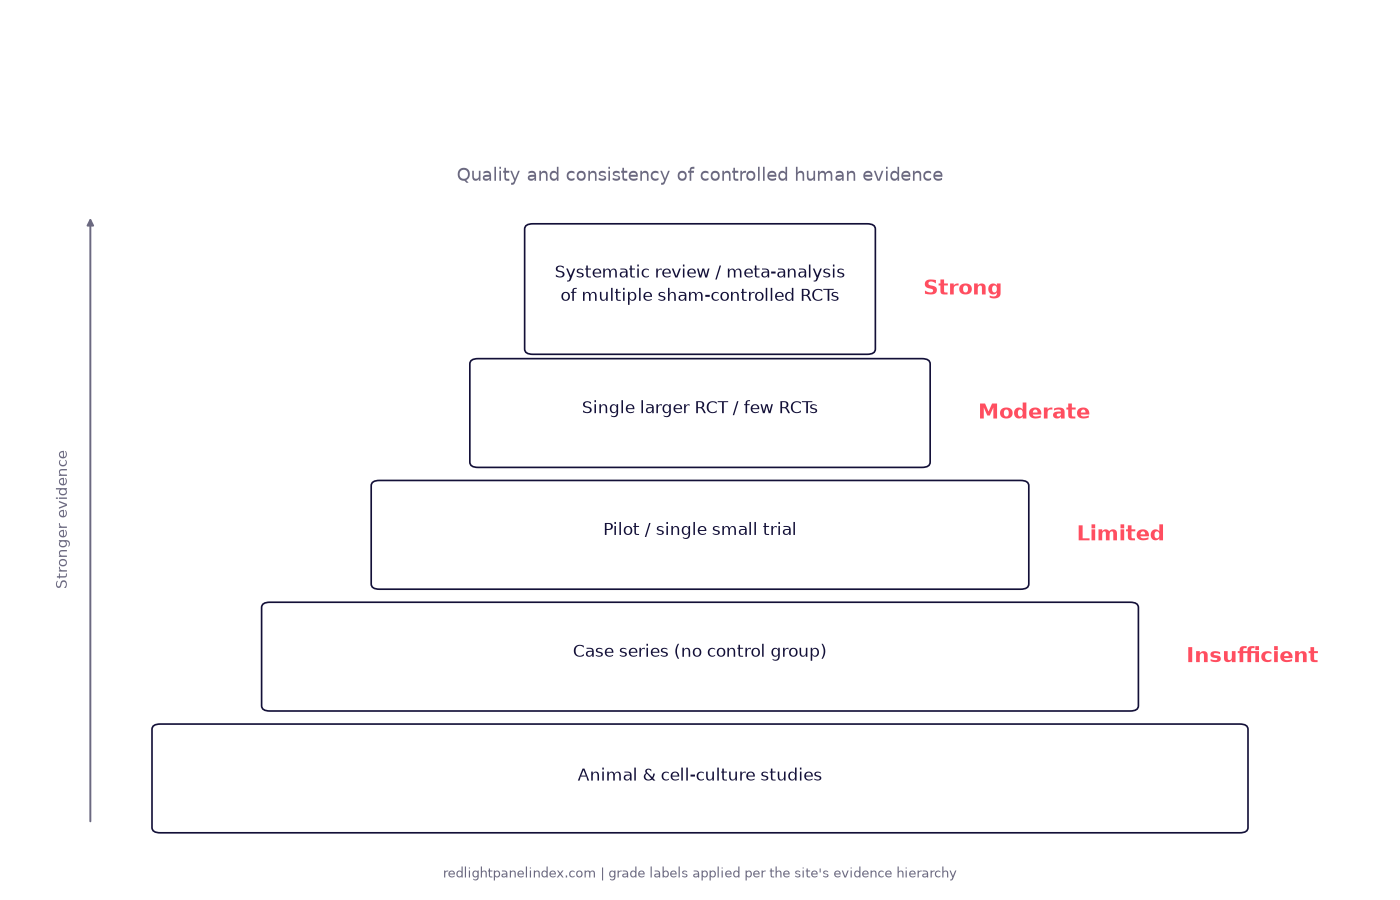
How This Site Grades Evidence: Strong to Insufficient
The four evidence grades this site uses, the trial hierarchy behind them, and one worked condition example at each grade, from knee pain to weight loss.
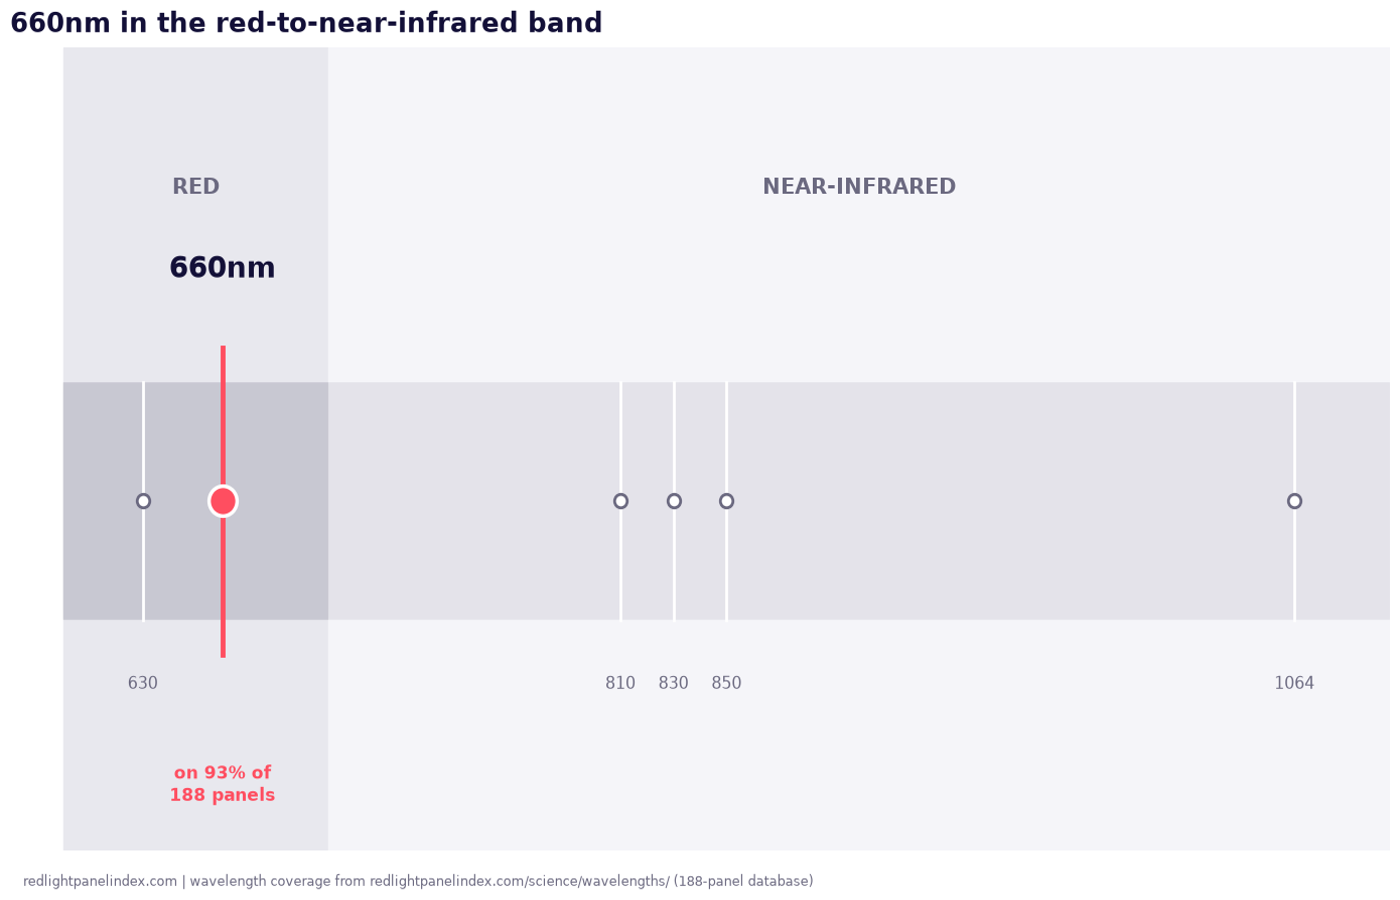
660nm Red Light: The Workhorse Wavelength
660nm sits on 93% of red light panels. What the wavelength does, the trials that used it, and how it differs from a nearby label like 655nm.
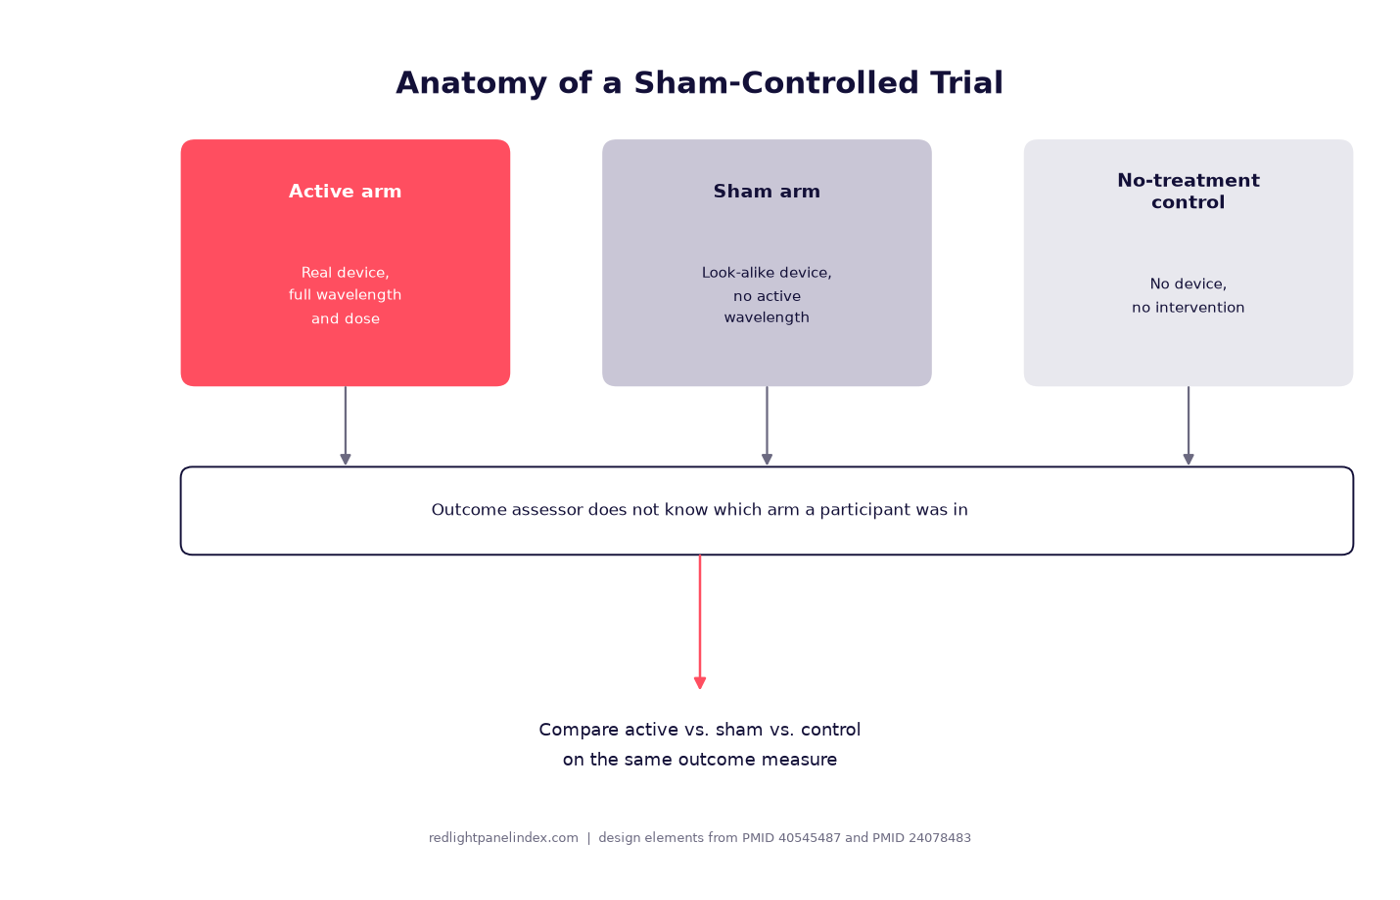
Sham-Controlled Trials: How to Read a Red Light Study
What a sham-controlled trial is, why blinding is hard when the light itself is visible, and how to read an abstract's claims against its design.
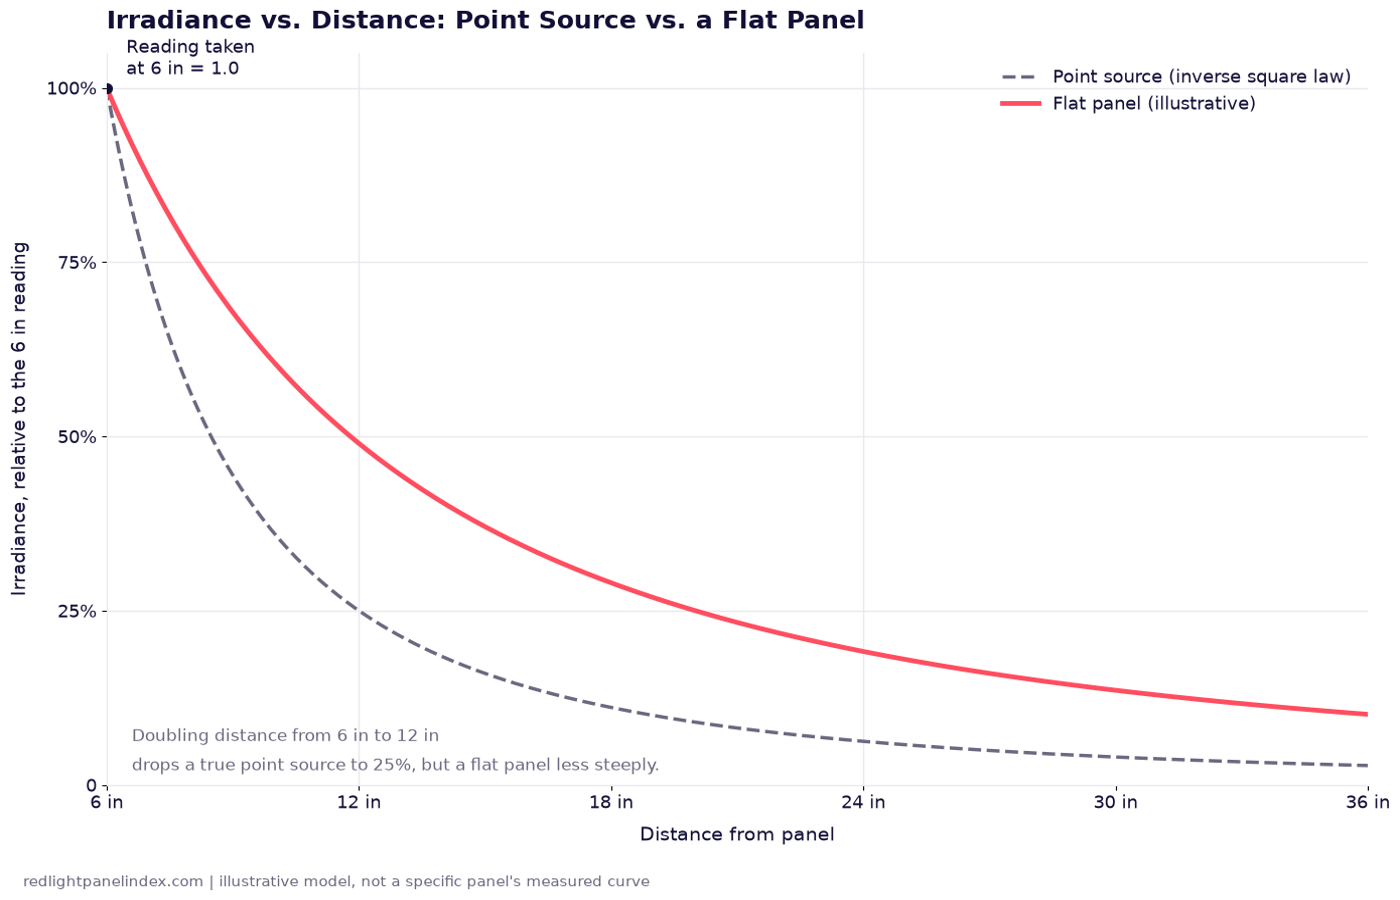
Inverse Square Law: Why It Only Half Applies
The inverse square law predicts how fast light fades with distance, but a flat panel is not a point source, so it fades slower than the law says up close.
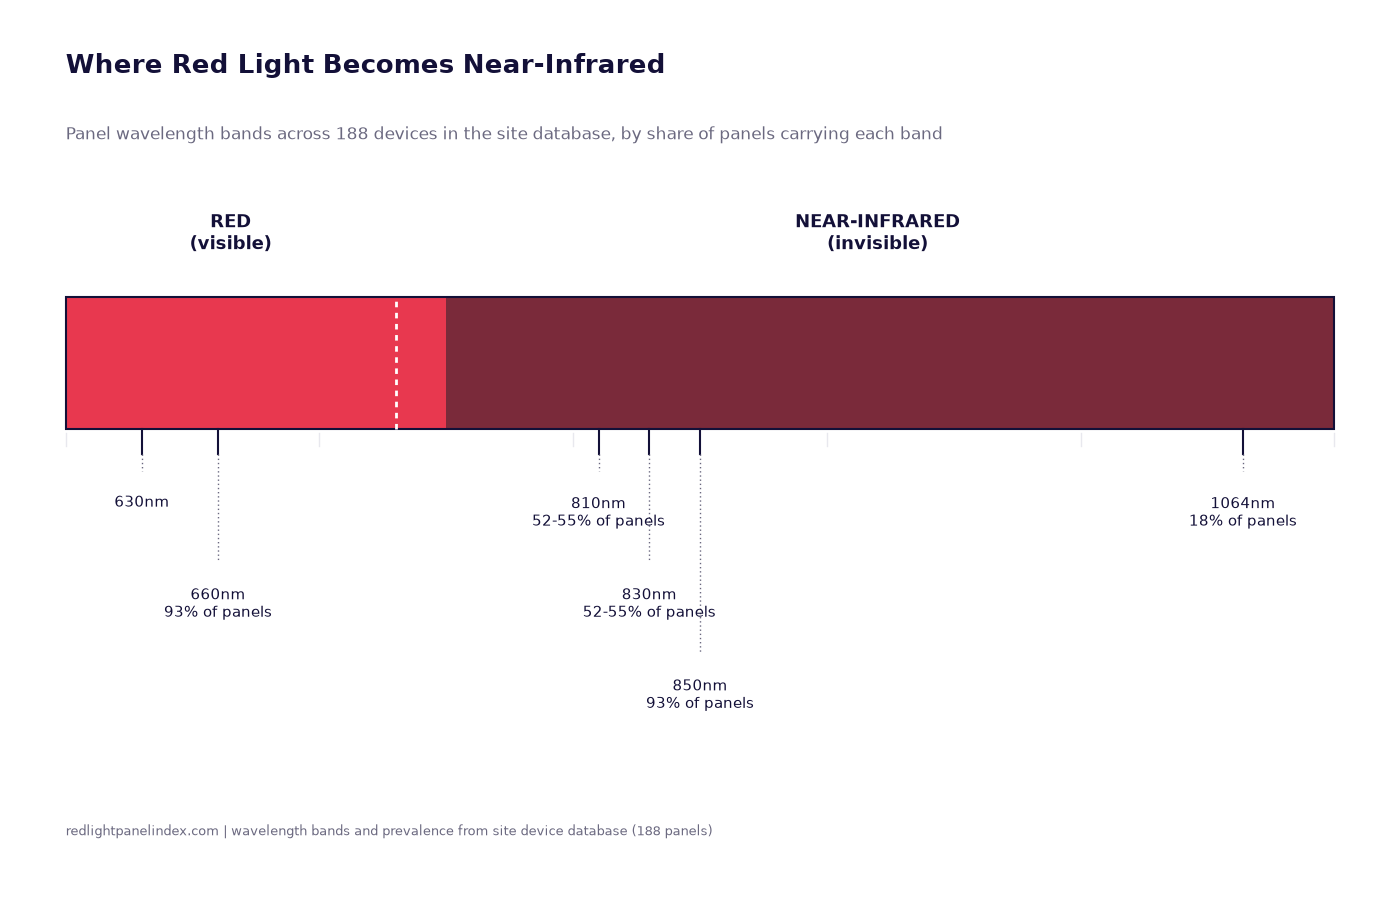
Red Light vs Near-Infrared: What Is the Difference?
Red (about 600-700nm) and near-infrared (700-1100nm) trigger the same cell mechanism but reach different depths. What separates the two bands.
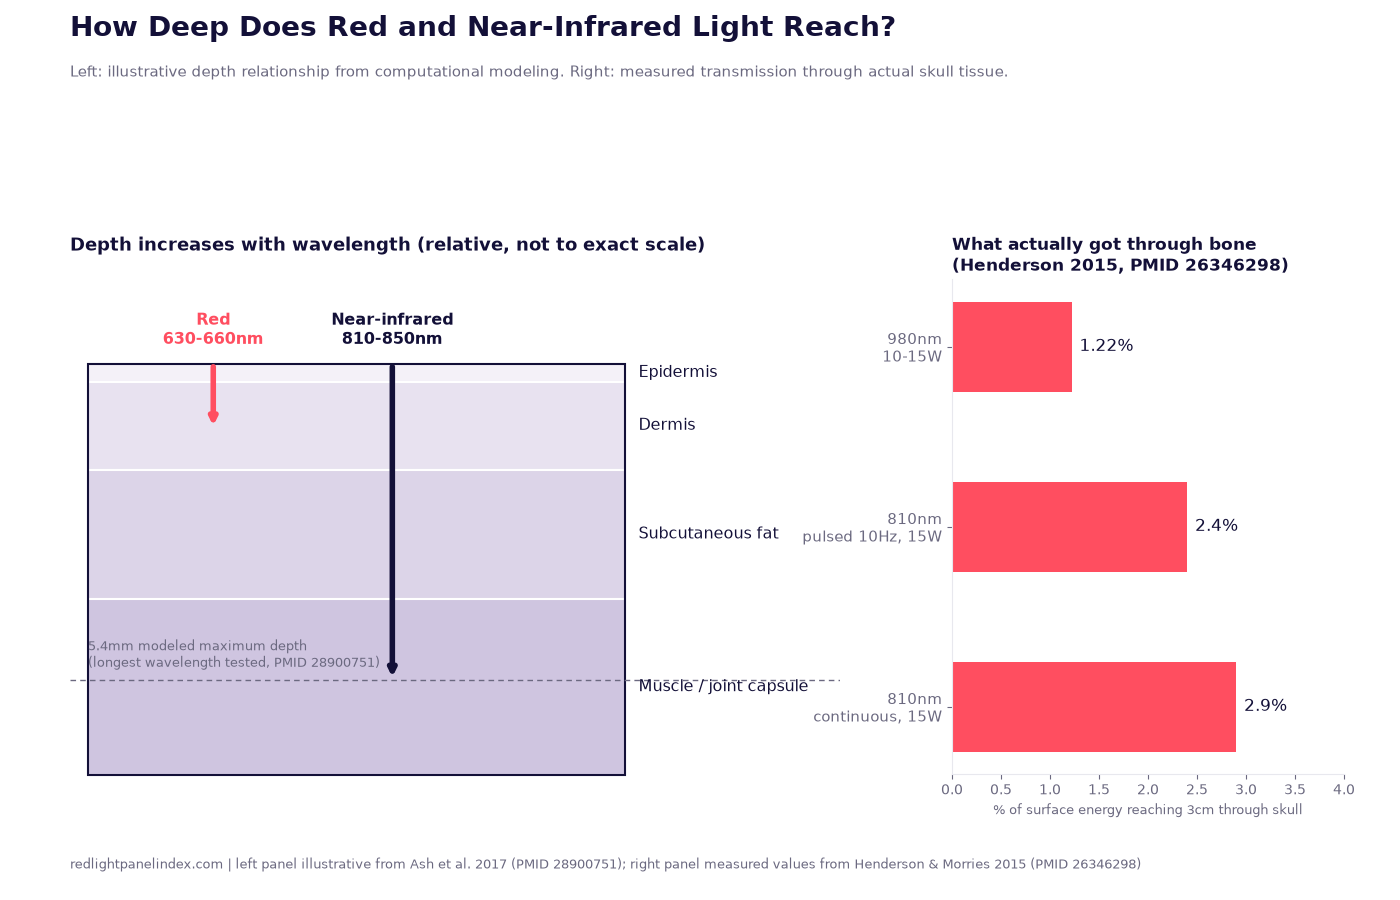
How Deep Does Red and Near-Infrared Light Penetrate?
What computational modeling and skull-transmission studies actually report about light penetration, and why "penetrates two inches" is not supportable.
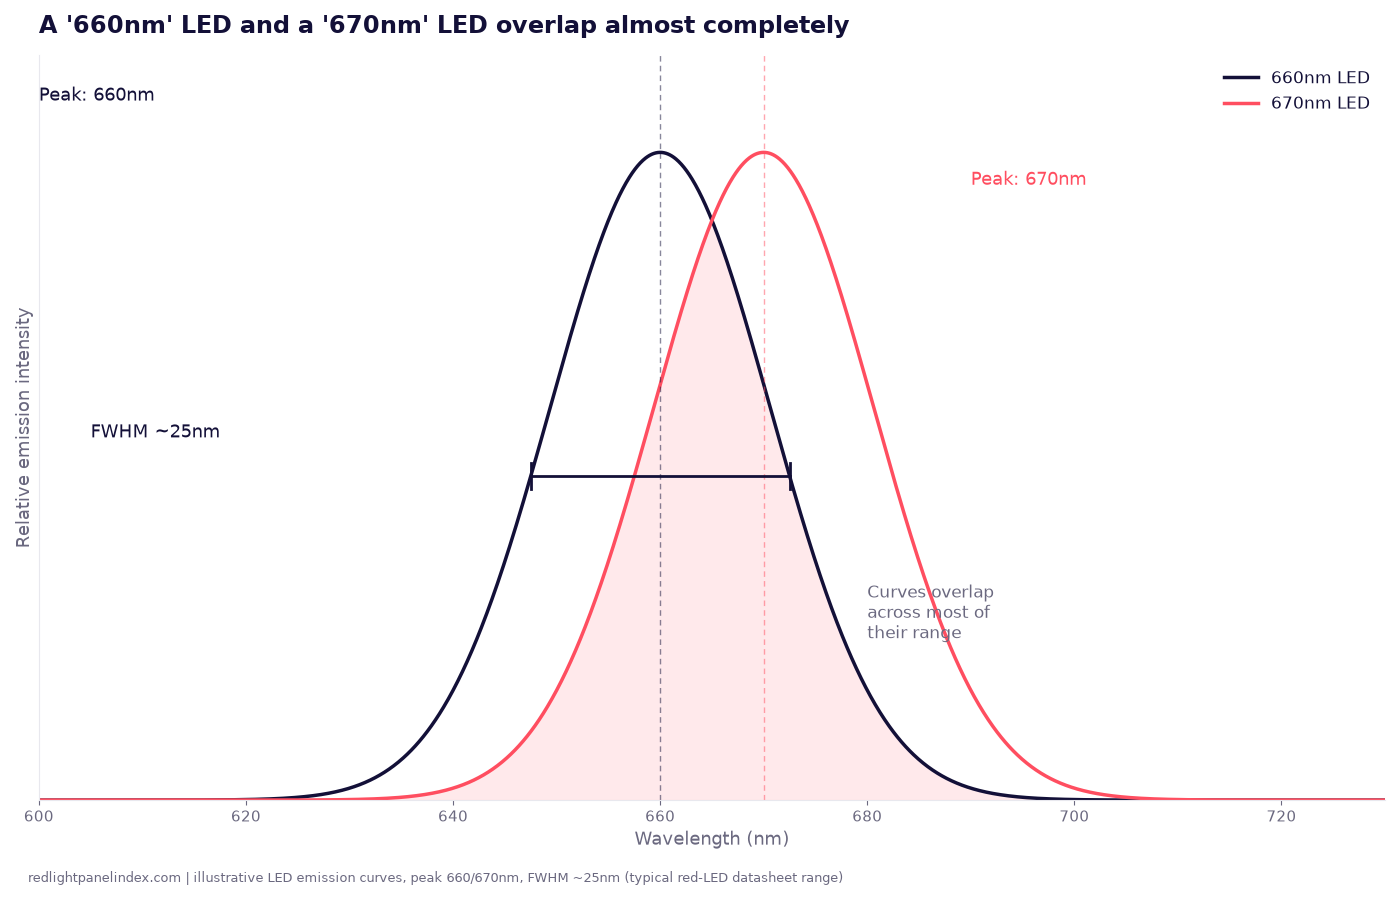
Peak Wavelength and FWHM: What '660nm' Really Means on a Spec Sheet
A 660nm LED does not emit a single wavelength. Peak wavelength and FWHM explain why panels labeled differently can overlap almost completely.
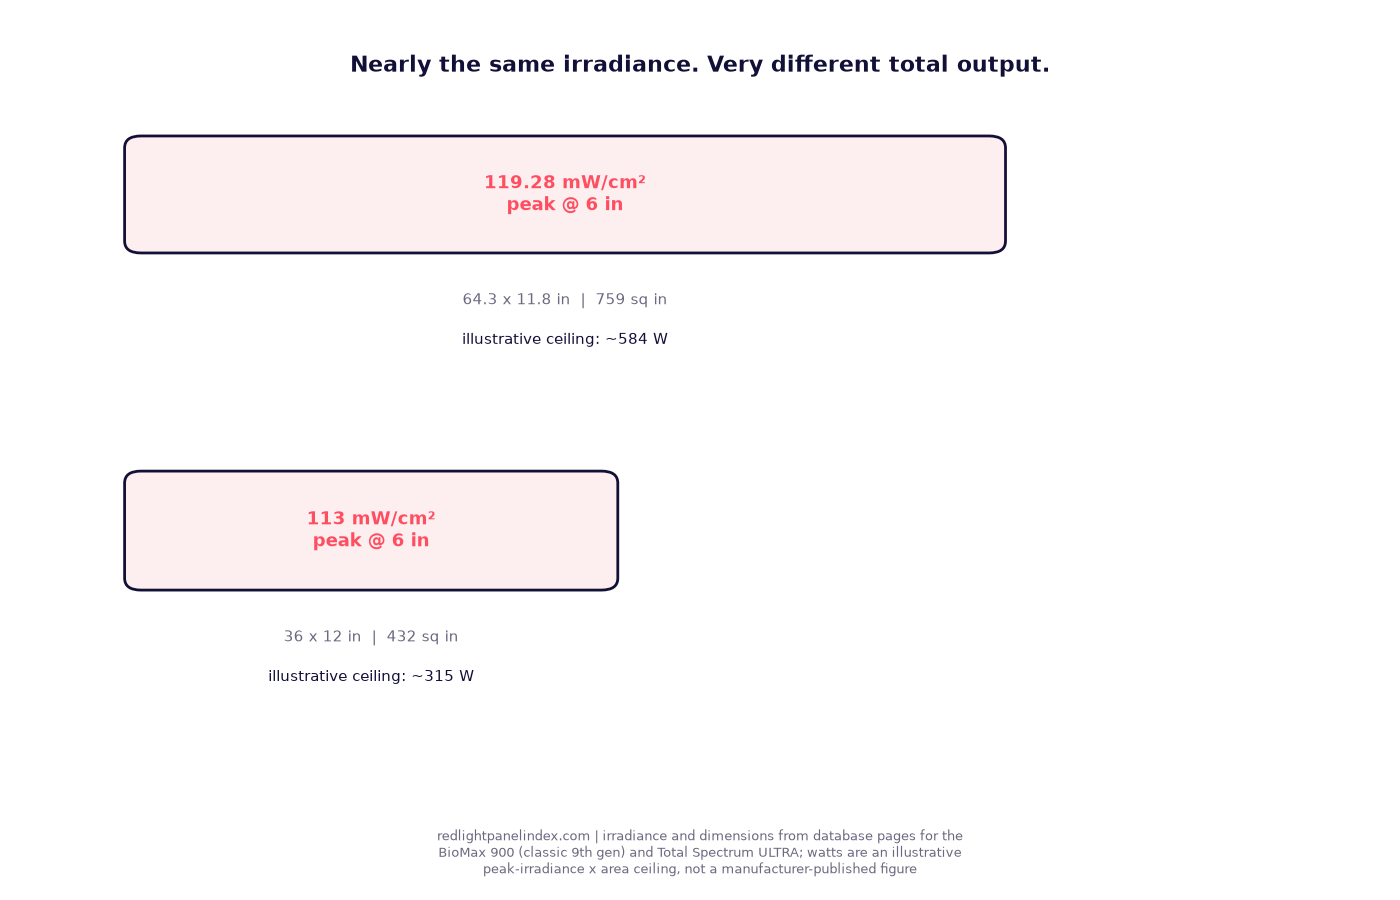
Irradiance vs Total Power: Which Number Matters?
Irradiance tells you the dose at one spot; total power tells you whole-panel output. Why they diverge, and which one to compare when panels differ in size.
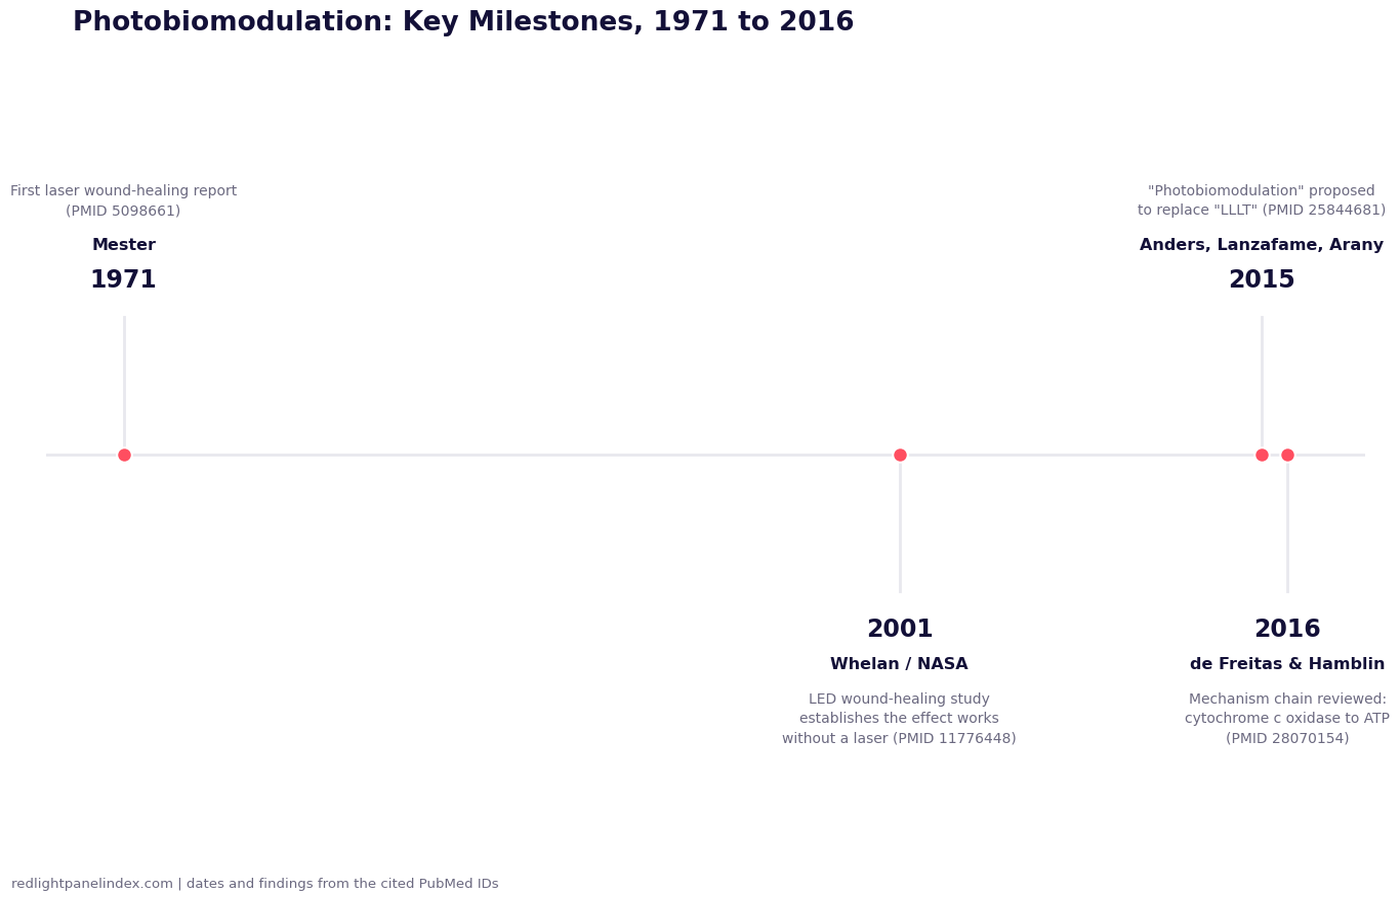
What Is Photobiomodulation? (And Why It Replaced "LLLT")
Photobiomodulation replaced "LLLT" in 2015 once LED research showed the effect works without a laser. The history, the studies and the mechanism.